Environmental Engineering Reference
In-Depth Information
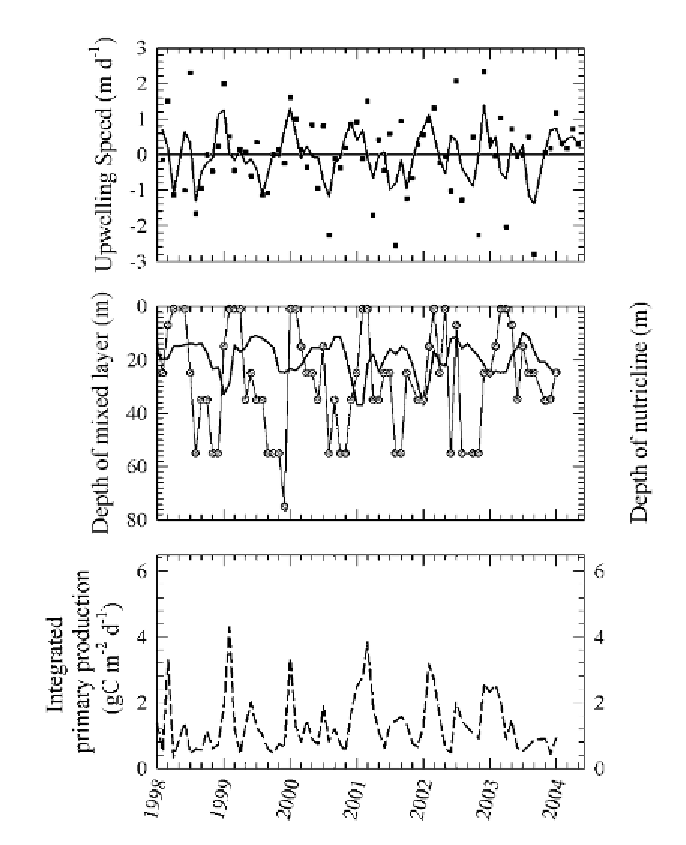
Figure 3.
Upper panel: Upwelling speed (squares) and two month running average of upwelling
speed (solid line) where upwelling speed is calculated as the rate of change of depth of the
25.6 isopycnal. Middle panel: depth of mixed layer (upper solid line plotted as two month
running average) and depth of nitricline (circles and grey line). Bottom panel: Integrated primary
production (dashed line).
measured nutrients in the surface waters, they may have been promptly removed
by a sudden increase in production.