Environmental Engineering Reference
In-Depth Information
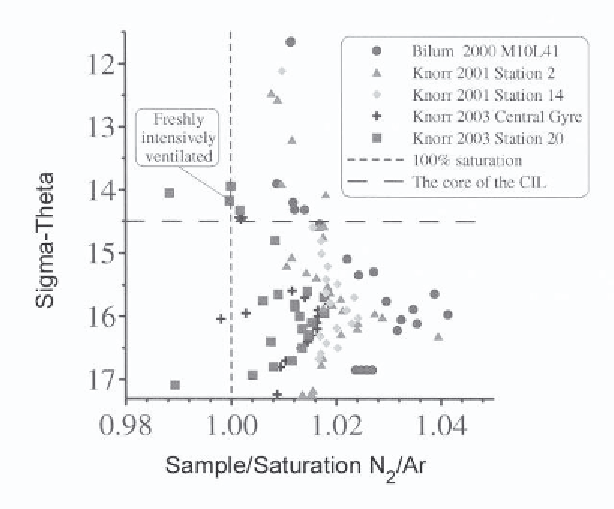
Figure 8.
N
2
/Ar solubility ratios versus density from Bilim 2000, Knorr 2001 and Knorr
2003. From [15]. The vertically dashed line shows what the ratio would be if the gases were at
atmospheric equilibrium. The surface values during Knorr 2003 Stn 20 were at this value. The
horizontal dashed line shows the characteristic density of the CIL.
by variable seasonal biological fluxes and meso-scale physical processes. This
structure described above is mainly observed in the central parts of the Black
Sea. Near the margins the maximums are often less well developed due to
stronger mixing.
It is generally assumed that the called “phosphate pumps and shuttles”
processes involving Mn and Fe cycling between oxidized and reduced forms
[59], are responsible for the extremes in the phosphate profile. In this process
phosphate is adsorbed by iron and manganese oxyhydroxides in the suboxic
zone that form due to upward transport (vertical diffusion is more important
than upwelling) of reduced Fe (II) and Mn (II) from the anoxic layer. The
maximum in the sulfide layer is due to reduction of these oxides as they sink
into the sulfide layer. The adsorbed PO
4
is released to solution where it can
then be transported upward to be scavenged again in the suboxic zone. Shaffer
[59] argued that both manganese and iron cycling contribute about equally to
this phosphate pump. Yao and Millero [75] found that sorption of phosphate
by MnO
2
was weaker than by iron hydroxides and that the content of MnO
2
in