Agriculture Reference
In-Depth Information
100
Nonlinear
80
200
100
60
Equil
50
40
30
20
10 hr
40
20
0
0
200
400
600
800 000
60
Adsorb
Desorb
50 hr
40
20
10 hr
0
0
200
400
600
800 000
Solution Concentration (μg/cm
3
)
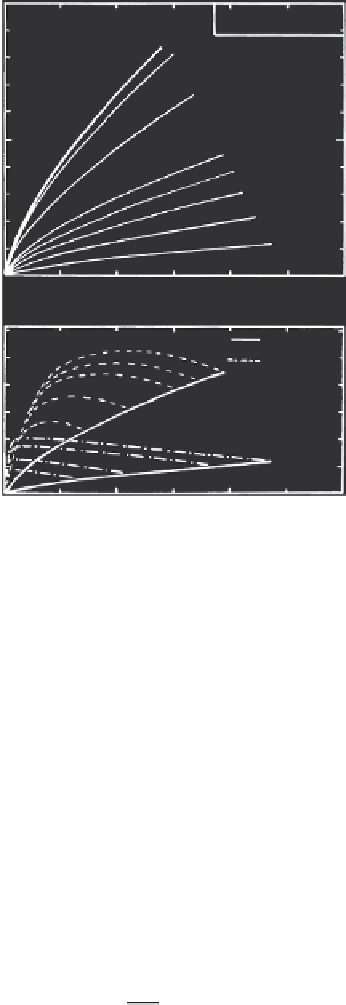
FIGURE 2.15
Simulated adsorption-desorption using a nonlinear kinetic retention model. Desorption was
initiated after 10 and 50 hours for each successive sorption step.
hysteresis parameter based on the maximum difference between an adsorp-
tion and a desorption isotherm:
N
N
×
a
ω=
−
1
100
(2.9)
d
where
N
a
and
N
d
are the exponent Freundlich parameter associated with
adsorption and desorption, respectively. Cox, Koskinen, and Yen (1997)
proposed another desorption hysteresis coefficient
H
, based on the ratio of
desorption and adsorption isotherm parameters:
N
N
a
H
=×
100
(2.10)
d
Both coefficients ω and
H
are simple and easy to calculate. Zhu and Selim
(2000) derived another formula to quantify the extent of hysteresis based
on the area under each adsorption and desorption curve. If
A
a
represents

Search WWH ::

Custom Search