Agriculture Reference
In-Depth Information
10
7
10
6
10
5
10
4
10
3
10
2
10
1
10
0
10
-1
Cd
Cu
Ni
2
4
6
8
10
2
4
6
8
10
2
4
6
8
10
Soil solution pH
Soil solution pH
Soil solution pH
10
7
10
6
10
5
10
4
10
3
10
2
10
1
10
0
10
-1
Zn
Pb
2
4
6
8
10
2
4
6
8
10
Soil solution pH
Soil solution pH
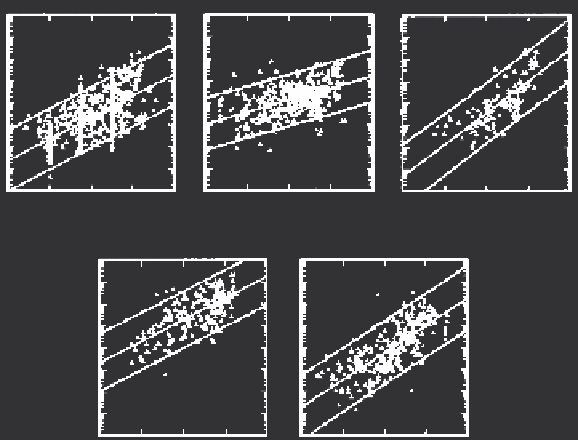
FIGURE 1.7
Plots of
K
d
versus soil pH for Cd, Cu, Ni, Pb, and Zn based on a compilation by Sauvé,
Hendershot, and Allen (2000). The upper and lower lines represent the 95% confidence inter-
vals. (From Sauvé, Hendershot, and Allen, 2000. With permission.)
Table 1.9 for sorption at one and seven days. These results illustrate the sorp-
tion affinity of the various soils for each of the heavy metals.
Copper isotherms for Houston and Olney soils are shown in Figures 1.8
and 1.9. The results indicate extremely high sorption of copper by both soils
as manifested by the low concentration in the soil solution after 24 hours
of sorption. This high sorption is due to the high clay content of Houston
clay as well as the presence of carbonates. The dashed and solid curves rep-
resent linear and Freundlich model simulations. For the Candor sand soils
shown in Figure 1.9, the isotherms indicate the lowest copper sorption. In
contrast, the Arapahoe soil shown in Figure 1.8 indicates extensive copper
sorption. Solid curves are simulations using the Freundlich model, which
best described the isotherms for all 10 soils. Best-fit parameter values for the
linear and Freundlich models along with their
r
2
are given in Table 1.3.
Cadmium isotherms for all soils are shown in Figures 1.10 and 1.11.
Houston, Arapahoe, and Sharkey soils exhibited the highest cadmium
sorption indicative of strong copper affinity for soils with high clay con-
tent and organic matter. The lowest sorption for copper is illustrated in

Search WWH ::

Custom Search