Agriculture Reference
In-Depth Information
9.5 Water-Unsaturated Soils
Selim, Davidson, and Rao (1977) simulated solute transport through water-
unsaturated multilayered soil profiles, where a steady vertically downward
water flow (
q
= constant) was considered. A soil profile was assumed to con-
sist of two distinct layers, sand and clay, each having equal lengths, and
was underlain by a water table at a depth
L
= 100 cm. The case where the
water table was at great depth (
z
→ ∞) was also considered. When a con-
stant flux was assumed, the steady state θ and water suction (
h
) distributions
for a sand-clay and a clay-sand soil profile were calculated (see Figure 9.7
for the sand-clay case). Solute concentration versus pore volume of effluent
(collected at 100 cm depth) for a nonreactive and reactive solute having lin-
ear (equilibrium) retention is shown in Figure 9.7. As expected, similar BTC
results for the nonreactive solute for sand-clay or clay-sand soil profiles were
obtained. In contrast, BTCs for the reactive solute show a distinct separation,
with lower retardation factors for the soil profiles having a water table at
z
= 100 cm than at
z
→ ∞. This observation is consistent for the sand-clay as
well as clay-sand profiles. Due to the higher water contents in the soil pro-
files where the water table was at
z
= 100 cm, the retardation factor
R
is less
in comparison to the case where the water table was at great depth (
z
→ ∞).
If the water content distributions were considered uniform, with an aver-
age water content within each individual layer (see Figure 9.8), the problem of
solute transport and retention through unsaturated multilayered soil profiles
can be significantly simplified as discussed in the previous section. The open
circles in Figure 9.8 are calculated results of concentration distributions for
Water suction
h
(cm)
Water suction
h
(cm)
0
20
40
60
80
100
0
20
40
60
80
100
0
0
20
20
θ
θ
h
h
40
40
Clay
Clay
sand
sand
60
60
θ
θ
80
80
100
0
100
0
0.1 0.2 0.3 0.4 0.5
Water Content θ, cm
3
/cm
3
0.1 0.2 0.3 0.4 0.5
Water Content θ, cm
3
/cm
3
(a)
(b)
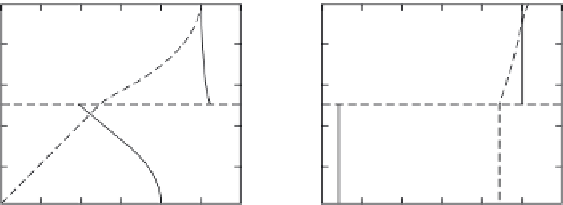
FIGURE 9.7
Simulated soil-water content θ and water suction
h
versus depth in a clay-sand profile having
a water table (A) at 100-cm depth and (B) great depth.

Search WWH ::

Custom Search