Agriculture Reference
In-Depth Information
1.0
Dothan - large pluse
(a)
0.8
v
= 2.74 cm hr
-1
0.6
Exp. data
One domain
Tw o domain
0.4
0.2
0.0
0
1
2
3
4
5
1.0
Dothan - small pluse predictions
(b)
0.8
v
= 2.74 cm hr
-1
0.6
Exp. data
One domain
Tw o domain
0.4
0.2
0.0
0
1
2
3
5
Pore Volume (V/V
o
)
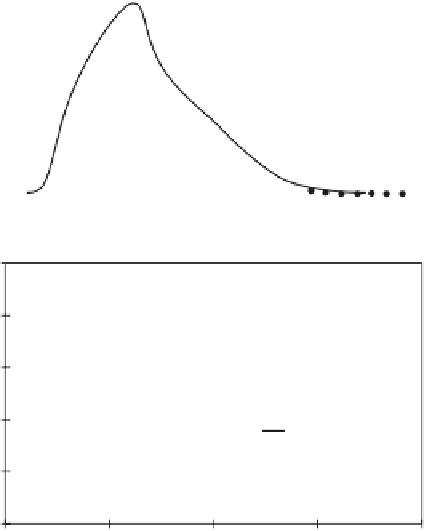
FIGURE 8.24
Tritium breakthrough curves (BTCs) for two Dothan soil columns with applied tritium pulses
of one pore volume (top figure) and 0.02 pore volume (bottom figure). Solid and dashed curves
are fitted BTCs with the one- and two-flow domain models, respectively.
The tritium BTCs presented in Figures 8.21 to 8.24 were fitted using both
the one- and two-flow domain models and are shown by the solid and
dashed curves. Although the two-flow domain model was superior over
the one-domain model in tritium BTC description, the BTCs from the large
pulse (one pore volume) were not perfectly described, especially on the tail-
ing side (Figures 8.21-8.24). Improvement in BTC fitting is difficult since
independent estimates of α based on experimental methods to differenti-
ate between macropores and micropores are not available. Nevertheless, the
two-flow domain was capable of capturing the double peaks of tritium for
three different soils.


Search WWH ::

Custom Search