Agriculture Reference
In-Depth Information
6
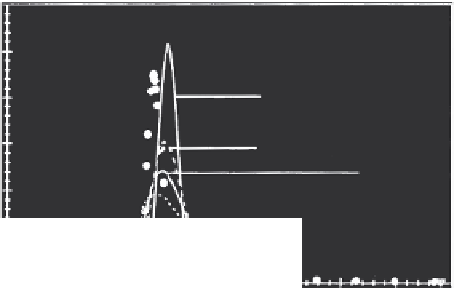
Cd breakthrough curve 100 mg/L - eustis soil
5
4
Equilibrium (α - ∞)
3
Kinetic: α = 20
10
5 d
-1
2
1
0
30
35
40
0
5
10
15
20
25
Pore Volume (V/V
o
)
FIGURE 7.7
Measured (closed circles) and predicted breakthrough curves in Windsor soil column. Curves
are predictions using equilibrium and kinetic ion exchange with different α values. (From
H. M. Selim and M. C. Amacher. 1997.
Reactivity and Transport of Heavy Metals in Soils
. Boca
Raton, FL: CRC Press. With permission.)
by 1.786 mmol
c
L
-1
Cd(NO
3
)
2
then 10 mmol
c
L
-1
of Ca(NO
3
)
2
subsequently
added. As a result of changes in the total concentration (
C
T
), a pronounced
snowplow effect was observed as shown in Figure 7.7. Here the measured
peak concentration was about five times the input Cd pulse. Moreover, use
of the ion exchange approach with the assumption of local equilibrium
adequately predicted the shape and location of the BTC, although the BTC
was somewhat more retarded than observed. The selectivity coefficient
(
K
12
) used in the simulations shown in Figure 7.5 was equal to 7.1, indicating
equal affinity of Cd and Ca to the soil surface. It is clear that the use of the
kinetic ion exchange improved overall prediction of the BTC even though
this resulted in the lowering of peak concentrations. Therefore, the competi-
tive ion exchange approach was capable of predicting the snowplow elution
of the Cd pulse from the soil column.
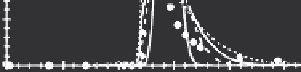
To further test the capability of the competitive model, two data sets from
multiple pulse applications are illustrated. Figures 7.8 and 7.9 are for Windsor
soil where Cd pulse applications were 10 and 100 mg L
-1
, respectively (Selim
et al., 1992). For all multiple pulses, the ion exchange approach well predicted
the position of the BTC peaks. In fact, the assumption of equilibrium ion
exchange adequately predicted the observed snow plow effect for the two
Windsor data sets. Good predictions were also obtained for peak maxima
for the 100 mg L
-1
data set (Figures 7.8 and 7.9). Calculated BTCs shown in
these figures were obtained from input parameters that were independently
determined. Specifically, curve fitting of the data was not implemented
to obtain the predictions shown. The shape of the Cd peaks of Figures 7.8
and 7.9 are due in part to the concentration and width or the number of pore
Search WWH ::

Custom Search