Agriculture Reference
In-Depth Information
Surface Soil
Carbonates Removed
Copper
1.0
0.8
0.6
SOM
0.4
0.2
0.0
0
20
40
60
80
100
Surface Soil
Carbonates Removed
1.0
0.8
SOM
0.6
0.4
Linear
0.2
0.0
0
20
40
60
80
100
Pore Volume (V/V
o
)
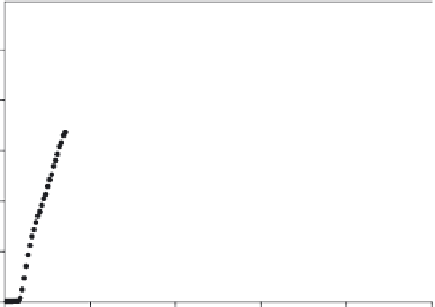
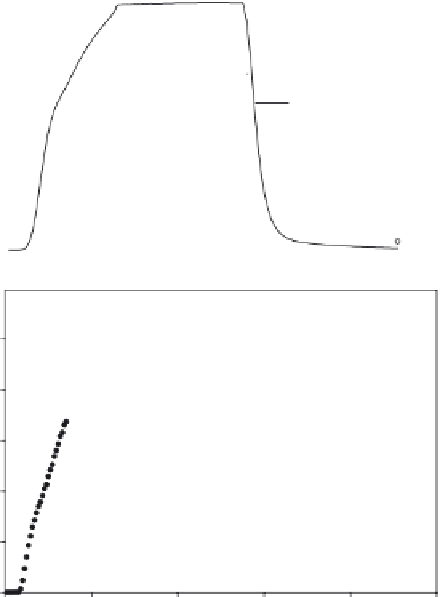
FIGURE 6.26
Breakthrough results of Cu and Ca from the surface soil after removed of carbonate. Solid
curves are simulations using the second-order model. The dashed curve represents linear
model predictions.
equilibrium sorption. The rate coefficient μ (h
-1
) associated with the sink
term (μ
C
) captures irreversible retention (or removal) of a chemical directly
from the soil solution based on first-order kinetics. The simulations shown
indicate early arrival of the Cu BTCs and failure to describe the tailing of the
leaching right side of the BTCs. In addition, concentration peak maxima of
the BTCs were underestimated.
Elbana and Selim (2012) investigated the influence of the removal of car-
bonates from the surface soil on Cu mobility, illustrated by the BTC shown
in Figure 6.26. The BTC is characterized by early arrival of Cu in the efflu-
ent (three pore volumes) and peak concentration
C
/
C
o
of 1.0. Moreover, 87%
of the applied Cu was recovered in the effluent solution. In contrast only


Search WWH ::

Custom Search