Agriculture Reference
In-Depth Information
1.0
0.8
A
B
0.6
C
0.4
0.2
D
0
0
4
8
12
16
V/V
o
20
24
28
32
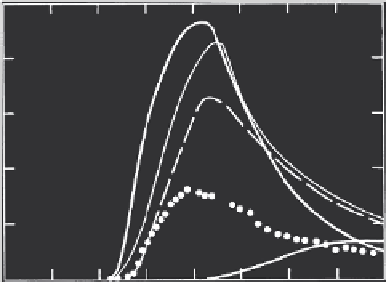
FIGURE 6.17
Effluent concentration distributions for Cr(VI) in Cecil soil. Curves A, B, C, and D are predic-
tions using the second-order model with batch rate coefficients for
C
o
of 100, 50, 25, and 10
mg/L, respectively. (From H. M. Selim, and M. C. Amacher. 1997.
Reactivity and Transport of
Heavy Metals in Soils
. Boca Raton, FL: CRC Press. With permission.)
is because no single or unique set of values for these rate coefficients was
obtained from the batch data, rather a dependence of rate coefficients on
input concentration (
C
o
) was observed. For all soils, several features of the
predicted BTCs are similar and indicate dependence on the rate coefficients
used in model calculations. Increased sorption during transport, lowering of
peak concentrations, and increased tailing were predicted when batch rate
coefficients from low initial concentrations (
C
o
) were used.
Figures 6.15 to 6.17 shows that using batch rate coefficients at
C
o
= 100 mg
L
-1
, which is the concentration of Cr(VI) in the input pulse, overestimated
Cr(VI) retention. Reasons for this overestimation, which has been observed
by other scientists, are not fully understood. Rate coefficients based on batch
experiments varied with
C
o
, which would be expected for pseudo rate coef-
ficients. Unless the concentrations of unaccounted for reaction components
remain relatively constant over the course of the experiment, rate coeffi-
cients will vary with
C
o
because they implicitly include concentrations of
other reaction components. Much larger changes were observed in Cr(VI)
concentrations in column effluent (pulse input) than in the batch solutions.
Moreover, in the batch experiment reaction products are not removed and
the reaction is considered a closed system. In the column experiment, on the
other hand, solutes are continually displaced. Also, in batch experiments the
soil suspension is continuously shaken, whereas in the miscible displace-
ment column experiment fluid flow is dominant and no such agitation of
the solid phase occurs. Model parameters
k
1
,
k
2
,
k
3
, and
k
4
did not vary over
the concentration range used in the batch experiment. Thus, a valid set of
rate coefficients from the batch experiment is readily available to cover the
Search WWH ::

Custom Search