Agriculture Reference
In-Depth Information
1.0
0.8
A
0.6
B
D
0.4
C
E
0.2
0
01234
V/V
o
5 678
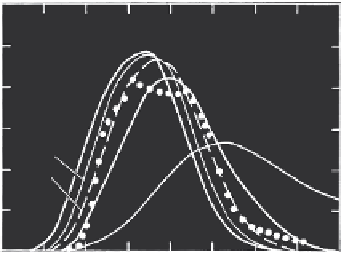
FIGURE 6.15
Effluent concentration distributions for Cr(VI) in Olivier soil. Curves A, B, C, D, and E are pre-
dictions using the second-order model with batch rate coefficients for
C
o
of 100, 25, 10, 5, and
1 mg/L, respectively (From H. M. Selim and M. C. Amacher. 1997.
Reactivity and Transport of
Heavy Metals in Soils
. Boca Raton, FL: CRC Press. With permission.)
we utilized the reaction rate coefficients
k
1
,
k
2
,
k
3
,
k
4
, and
k
s
as obtained from the
batch kinetic data in the predictions of Cr(VI) BTCs. In the following discus-
sion, predicted curves imply the use of independently measured parameters in
model calculations as was carried out here using the batch-derived parameters.
The predicted BTCs shown in Figures 6.15, 6.16, and 6.17 were obtained
using different sets of rate coefficients (
k
1
,
k
2
,
k
3
,
k
4
, and
k
s
) in the SOM. This
1.0
0.8
A
B
0.6
C
0.4
D
E
0.2
0
0
2
4
6
8
V/V
o
10
12
14
16
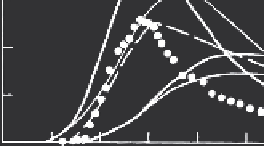
FIGURE 6.16
Effluent concentration distributions for Cr(VI) in Windsor soil. Curves A, B, C, D, and E are
predictions using the second-order model with batch rate coefficients for
C
o
of 25, 10, 5, 2, and
1 mg/L, respectively. (From H. M. Selim and M. C. Amacher. 1997.
Reactivity and Transport of
Heavy Metals in Soils
. Boca Raton, FL: CRC Press. With permission.)
Search WWH ::

Custom Search