Agriculture Reference
In-Depth Information
C
o
= 100
100
75
50
25
10
10
5
1
2
1
Windsor
0.1
0 8 6
144
192
240
288
336
Time, h
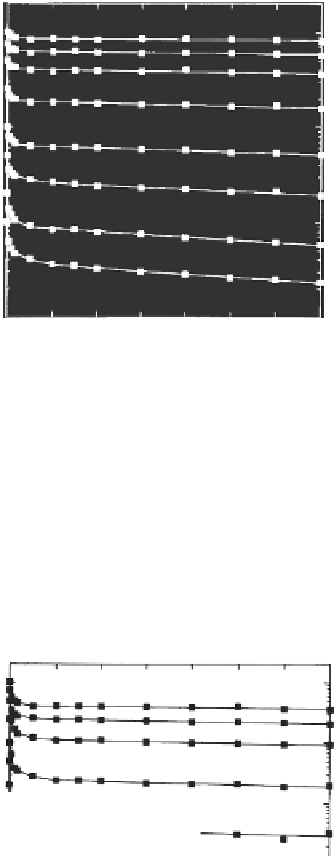
FIGURE 6.13
Time-dependent retention of Cr(VI) by Windsor soil. Closed squares are the data points and
solid lines are second-order model predictions for different initial concentration curves (
C
o
= 1,
2, 5, 10, 25, 50, 75, and 100 mg @ L
-1
). (From H. M. Selim and M. C. Amacher. 1997.
Reactivity and
Transport of Heavy Metals in Soils
. Boca Raton, FL: CRC Press. With permission.)
If the fraction of type 1 sites is small as was the case with the Olivier and
Windsor soils, then their contribution to the kinetic solute retention curve
will be small and indistinguishable at high solute concentrations. For the
Cecil soil where the fraction of type 1 sites was significant (
F
= 0.224), the
five-parameter model version was superior to the three-parameter version
100
C
o
= 100
75
50
10
25
1
10
5
0.1
2
0.01
1
Cecil
0.0001
0 8 6
144
Time, h
192
240
288
336
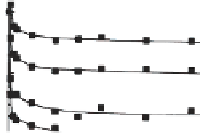
FIGURE 6.14
Time-dependent retention of Cr(VI) by Cecil soil. Closed squares are data points and solid
lines are second-order model predictions for different initial concentration curves (
C
o
= 1, 2,
5, 10, 25, 50, 75, and 100 mg @ L
-1
). (From H. M. Selim and M. C. Amacher. 1997.
Reactivity and
Transport of Heavy Metals in Soils
. Boca Raton, FL: CRC Press. With permission.)
Search WWH ::

Custom Search