Agriculture Reference
In-Depth Information
1.0
0.8
F
= 0.1
0.6
0.2
0.5
0.4
0.8
0.2
1.0
0
0
1234
5678
9 0
V/V
o
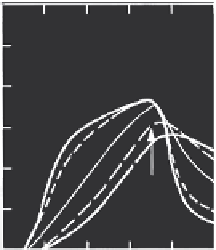
FIGURE 6.10
Effluent concentration distributions for different values of the fraction of sites
F
using the
second-order model. (From H. M. Selim and M. C. Amacher. 1997.
Reactivity and Transport of
Heavy Metals in Soils
. Boca Raton, FL: CRC Press. With permission.)
of Ω. This is largely due to the nonlinearity of the proposed second-order
retention mechanism. As given by Equation 6.26, Ω represents the ratio of
total sites (
S
max
) to input (pulse) solute concentration (
C
o
). Therefore, for small
values of Ω (e.g., Ω = 0.1), the simulated BTC is very similar to that for a
nonretarded solute due to the limited number of sites (
S
max
) in comparison
to
C
o
. In contrast, large values of Ω resulted in BTCs that indicate increased
retention as manifested by the right shift of peak concentration of the BTCs.
In addition, for high Ω, extensive tailing as well as an overall decrease of
effluent concentration were observed.
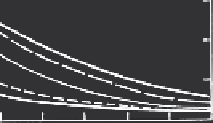
The effect of the dimensionless reaction rate coefficients (κ
1
, κ
2
, κ
3
, and κ
4
)
of the two-site model on solute retention and transport is illustrated by the
BTCs of Figure 6.9 where a range of rate coefficients differing by three orders
of magnitude were chosen. For the BTCs shown, the rate coefficients for type
2 sites were chosen to be one order of magnitude smaller than those associ-
ated with type 1 sites. These BTCs indicate that, depending on the values of
κ
1
, κ
2
, κ
3
, and κ
4
, two extreme cases can be illustrated. For large values of κ,
rapid sorption-desorption reactions occurred for both type 1 and type 2 sites.
Rapid reactions indicate that the retention process is less kinetic and BTCs
can approximate local equilibrium conditions in a relatively short contact
time. Examples are those of curves C and D. In contrast, for extremely small
values of κ
1
, κ
2
, κ
3
, and κ
4
(or small residence time), little retention takes place
and the shape of the BTC resembles that for a nonreactive solute (see curve
A). The behavior of all illustrated BTCs is consistent with those for first-order
kinetic and for two-site nonlinear equilibrium-kinetic reactions.
Figure 6.10 shows BTCs for several values of the fraction of sites parameter
F. There are similar features between the BTCs of Figures 6.8 and 6.9 and
those illustrated in Figure 6.10. For
F
= 1, all the sites are type 1 sites which

Search WWH ::

Custom Search