Agriculture Reference
In-Depth Information
1.0
0.8
q
= 0.1 cm day
-1
0.6
1
0.4
4
10
0.2
40
0
0
1
2
3
4
5
6
7
8
9 0
V/V
o
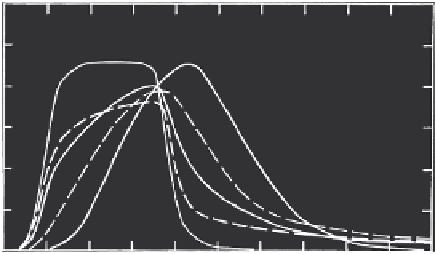
FIGURE 6.6
Effluent concentration distributions for different flux (
v
) values using the second-order model.
(From H. M. Selim and M. C. Amacher. 1997.
Reactivity and Transport of Heavy Metals in Soils
.
Boca Raton, FL: CRC Press. With permission.)
fully water-saturated soil column initially devoid of a particular reactive
chemical of interest. In addition, a steady water-flow velocity (
q
) was main-
tained constant with a Peclet number
P
(=
q
/Θ
D
) of 25. The length of the
pulse was assumed to be three pore volumes, which was then followed by
several pore volumes of a reactive chemical-free solution. The rate coefficients
selected were 0.01, 0.1, 0.001, and 0.01 day
-1
for
k
1
,
k
2
,
k
3
, and
k
4
, respectively.
As a result, the equilibrium constants ω
1
and ω
2
for sites 1 and 2, respectively,
were identical.
Figure 6.4 shows breakthrough curves (BTCs), which represent the relative
effluent concentration (
C
/
C
o
) versus effluent pore volume (
V
/
V
o
), for several
input
C
o
values. The shape of the BTCs is influenced by the input solute concen-
tration and is due to the nonlinearity of the proposed second-order retention
mechanism. The simulated results also indicate that for high
C
o
values the BTCs
appear less retarded and have sharp gradients on the desorption (or right) side.
In contrast, for low
C
o
values the general shape of the BTCs appear to be kinetic
in nature. Specifically, as
C
o
decreases, a decrease in maximum or peak concen-
trations and extensive tailing of the desorption side of the BTCs can be observed.
The influence of the total number of (active) sites (
S
max
) on the BTC is clearly
illustrated by the cases given in Figure 6.5. Here the value of
C
o
was chosen
constant (
C
o
= 10 mg L
-1
). The BTCs show that an order of magnitude increase
in
S
max
(from 50 to 500 mg ≅ kg
-1
) resulted in an approximately three pore
volume shift in peak position. In addition, for high
S
max
values extensive tail-
ing and an overall decrease of effluent concentrations (
C
/
C
o
) were observed.
The influence of the flow velocity (
q
) on the shape of the BTC is somewhat
similar to that of the rate coefficients for retention provided that the Peclet
number (
P
) remains constant. This is illustrated by the simulations shown
in Figure 6.6 for a wide range of flow velocities. For
q
= 40 cm day
-1
, the
Search WWH ::

Custom Search