Agriculture Reference
In-Depth Information
Time (days)
0
10
20
30
40
50
60
70
80
90 100 110 120 130 140 150
1.0
0.9
0.8
0.7
0.6
0.5
0.4
0.3
0.2
0.1
0.0
Observed
NLE
FRK
NLE-FOK
0
2000
4000
6000
8000 10000 12000 14000 16000 18000 20000
V/V
o
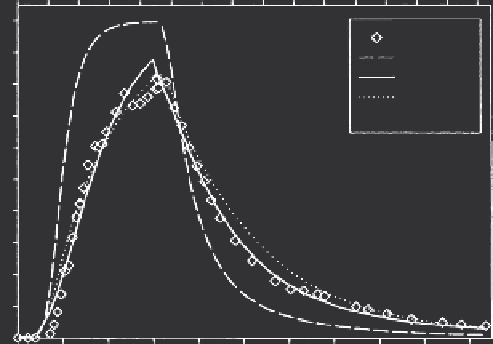
FIGURE 5.8
Observed and model calculated breakthrough curves for U(VI) in Hanford (HF) column. Pulse
input
C
o
= 0.29 mg/L, pH = 6.8 in 0.01 M NaNO
3
. The solid curve is based on the multireaction
model with only
S
1
considered; the dotted curve shows
S
e
and
S
1
reversible phases. The dashed
curve is based on the assumption of nonlinear (Freundlich) equilibrium.
Figure 5.8 shows breakthrough results from a column of Hanford soil
where a pulse input of uranium (U(VI)) in a 0.01 M NaNO
3
background
matrix was introduced to each of the columns at a flow rate of 4.3 cm/h
(Barnett et al., 2000). After the pulse, the inlet solution was switched to a
U(VI)-free, 0.01 M NaNO
3
solution. The observed results indicate that U(VI)
is highly mobile where total recovery was attained. The solid curve is based
on model calculations where only
S
1
was considered, whereas the dotted
curve is where
S
e
and
S
1
reversible phases were used. The dashed curve is
based on the assumption of full equilibrium with S
e
only. Therefore, a combi-
nation of fully reversible equilibrium and kinetic reactions best describe the
U(VI) transport in Hanford soil.
Transport results of two military explosives, TNT and RDX, are illus-
trated by the BTCs shown in Figure 5.9 (Selim, Xue, and Iskandar, 1995).
A pulse having a concentration of either 10 or 100 mg/L TNT or RDX dis-
solved in 0.005 M Ca(NO
3
)
2
solution was introduced into each column at
the same flux. The applied pulse was subsequently followed by several
pore volumes of the background solution. In comparison with the tracer
tritium, RDX exhibited high mobility and little tailing. The solid curve is
Search WWH ::

Custom Search