Agriculture Reference
In-Depth Information
1.0
D
= 1.0
0.8
1.1
1.2
1.5
1.6
0.6
0.4
0.2
0.0
40
60
80
100
120
140
160
Travel Distance (m)
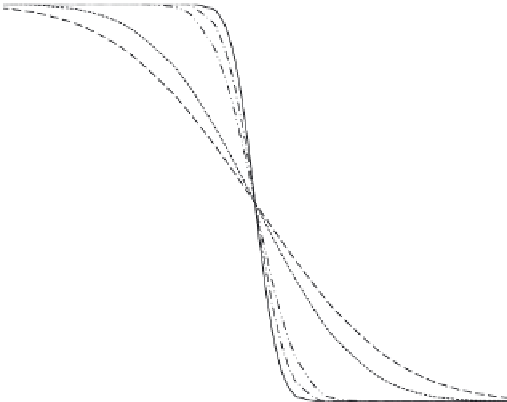
FIGURE 4.8
Comparison of solute profiles for systems with different fractal dimension at mean travel dis-
tance of 100 meters.
1.0
D
= 1
1.1
0.8
1.2
1.5
1.6
1.7
0.6
0.4
0.2
0.0
500
700
900
1100
1300
1500
Travel Distance (m)
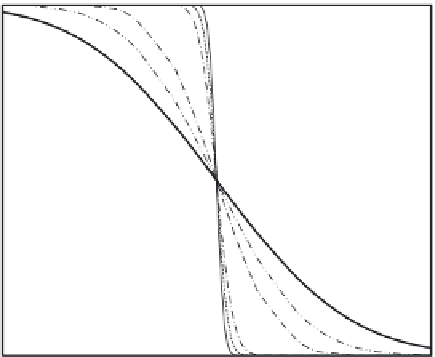
FIGURE 4.9
Comparison of solute profiles for systems with different fractal dimension at mean travel dis-
tance of 1000 meters.


Search WWH ::

Custom Search