Environmental Engineering Reference
In-Depth Information
Table 23.2 Relative dominance of tree species in
three
woodlands (%)
Woodland
Oak
Ash
Birch
Alder
Pine
A
20
20
20
20
20
B
40
30
30
0
0
C
0
0
10
0
90
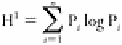
account both species richness and relative abundance. Several measures do so, but the
most widely used is the
Shannon diversity index
, which is calculated by:
where
n
= number of species, P
i
= proportion of the
i
th species as a proportion of total
cover and log = log base
n
(usually log
10
). The Shannon index is also known (correctly) as
the
Shannon-Wiener index
, and (incorrectly) as the Shannon-Weaver index. It is derived
from the complex mathematical field of information theory and hence its alternative
name of
information theoretic index
. An example of the calculation of the Shannon
index for the data in Table 23.2 is given in Table 23.3, using log
10
. The most diverse
woodland is community A, with five species of equal dominance. The second most
diverse is woodland B, which has fewer species than woodland A and also has a more
uneven distribution, with oak being dominant. Woodland C, a pine plantation, has the
lowest diversity, being almost a monoculture. The Shannon-Wiener values which reflect
this trend are 0·70, 0·48 and 0·15 respectively. Despite the relative ease with which the
index can be calculated, much discussion of the diversity and complexity of ecosystems
is still based on species richness rather than on both richness and evenness. Other indices
of complexity are more difficult to handle, because of the sophistication of the data
required. Thus
connectance
in an ecosystem describes the actual number of interactions
between species divided by the number of possible interactions between species. For
example, a community of
n
species can have a minimum connectance of (
n
− 1) and a
maximum connectance of:
Thus a community of four species can have a minimum of three interactions and a
maximum of six. Connectance is important as an index of how strongly all the species in
the system interact; if it were possible, it would be very useful to distinguish pairs of
species which interact from those which do not (Figure 23.1).
Table 23.3 Shannon indices for three woodlands
Species
Cover (%)
Proportion (P
i
)
Log P
i
P
i
log P
i
Woodland A
Oak
20
0·2
−0·70
−0·14