Environmental Engineering Reference
In-Depth Information
axis is equivalent to 10° C or 20 mm precipitation. This ratio of 1:2 is the same for all
diagrams. It would be more accurate to use potential evapotranspiration, but the data are
available for only a few places. The temperature curve and potential evaporation curve
are not identical, but they are roughly parallel, with the temperature curve below the
potential evaporation curve. The diagrams therefore show the length and intensity of
humid and arid seasons, the length and severity of cold winters, and the likelihood of
early and late frosts.
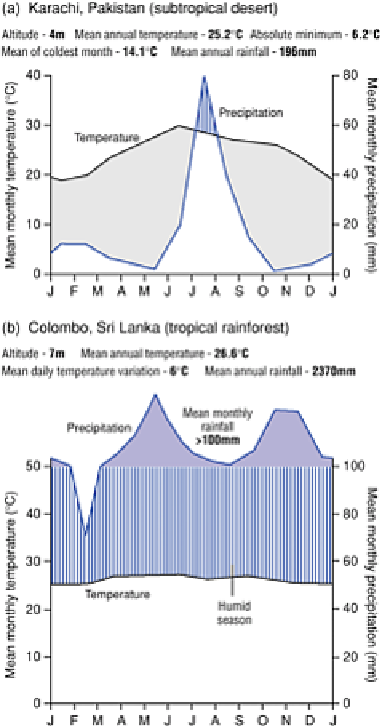
Figure 1
Climatic diagrams for (a) a subtropical desert and (b) a
tropical rain forest.