Environmental Engineering Reference
In-Depth Information
points are the
upper limit of tolerance
and the
lower limit of tolerance
. In Figure 20.2 this
tolerance range is shown as a broad-based normal curve, though in reality it may be much
narrower for a particular species on a particular gradient. The
ecological optimum
for the
species is that part of the tolerance range where the vigour of the plant is at a maximum.
In the real world there are two complications in the concept of tolerance range. First, a
species has a separate range for each environmental factor. Each separate response
includes a different range and optimum. When all ranges are added together we get the
ecological amplitude
of the species. This is a multidimensional 'hyperspace' which it is
not easy to define or represent. However, it is a useful concept for summarizing the sum
total of the effects of all environmental factors. The second complication is that plants
differ in their ability to utilize a resource which is in limiting supply. The process of
competition
will eliminate the less efficient plant, or the less efficient species.
Competition between individuals of the same species is
intraspecific competition
, and
often occurs at the beginning of successions on fresh, bare surfaces where colonizers are
competing for space. Competition between species,
interspecific competition
, is
universal, and results in actual species ranges that are much narrower than their full
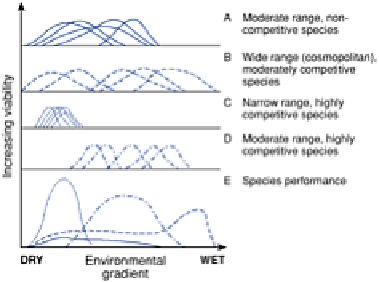
tolerance ranges. Figure 20.3 shows the viability of four species with different
competitive abilities along an environmental gradient (say, soil moisture). Species A is
not competitive, and therefore remains a secondary component of the final communities.
Species B has a wide range of tolerance but is only moderately competitive, and there-
Figure 20.3
The viability of four plant species of different
competitive abilities (A-D) in relation to an environmental
gradient. Graph E shows the resulting distribution of the four
species along a gradient of wetness.
fore dominates at the wet end of the gradient. Species C is highly aggressive and
dominates in its narrow range, as does species D for most of its wider range. The
resulting structure of the plant communities along the gradient, in terms of dominant and
secondary species, is shown at E. The pattern of plants which results is thus the result of
two broad influences: first, the
range of tolerance
of the species of an environmental
gradient and, second, the interspecific competition between the plants.