Environmental Engineering Reference
In-Depth Information
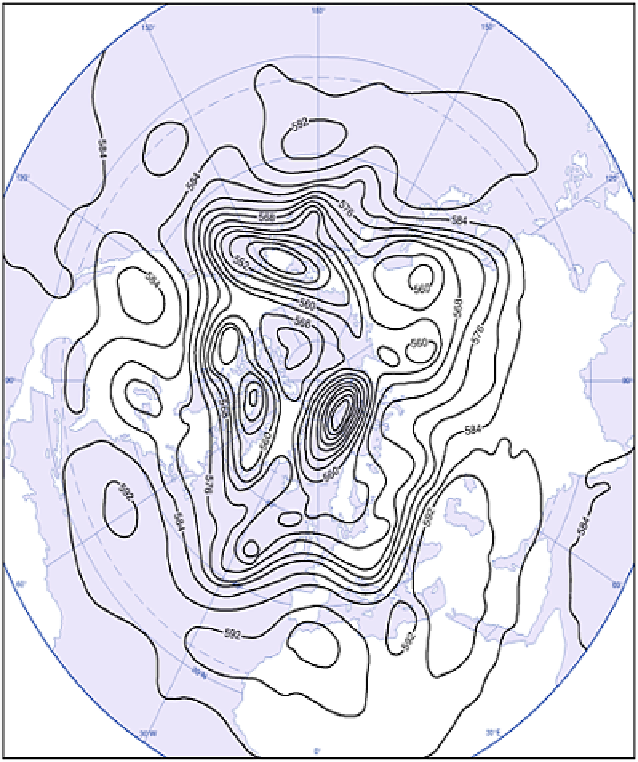
Figure 6.15
The forecast pattern of upper westerlies at 500
hPa on 30 July 2000, showing the height of the 500 mb
pressure level above a fixed datum near sea level. Winds
blow parallel to the contours at a speed proportional to the
gradient.
Source: http://www.ecmwf.int
words, the flow more nearly approximates to the geostrophic winds that, it will be
remembered, result from the interaction of the pressure gradient and the Coriolis force
(Figure 6.15).
The zonal flow of the upper winds can be shown on average as a cross-section from
north to south (Figure 6.16). In fact variations around this average picture are slight,
except in the monsoon areas of Asia. At each season the same basic pattern exists, with