Environmental Engineering Reference
In-Depth Information
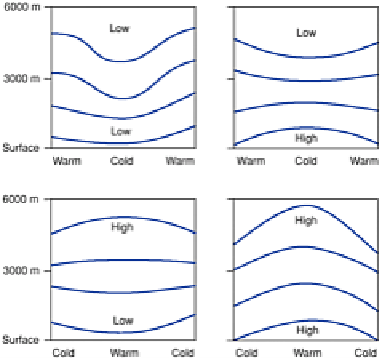
Figure 6.5
Effect of vertical temperature variations on
pressure surfaces.
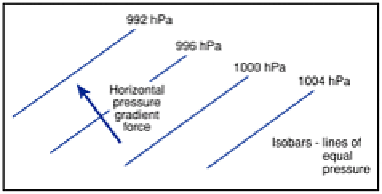
areas of low pressure (Figure 6.6). The magnitude of the force causes movement (the
pressure gradient force), and so the speed of the wind is inversely proportional to the
distance between the isobars. Thus the closer the isobars are together, and the more
rapidly pressure falls with distance, the stronger is the wind.
Mathematically, this relationship can be written as:
where pressure values at points 2 and 1 are
p
2 and
p
1,
n
is the distance separating points
2 and 1; ρ is air density and
F
is the resulting acceleration. We can use this formula to
indicate how quickly the parcel ought to accelerate. The standard isobaric interval on
pressure charts is 5 hPa and air density is 1·29 kg m
−3
. Suppose the isobars are 300 km
Figure 6.6
Horizontal pressure gradient force acting at right-
angles to the isobars.
apart on a sea-level chart. What will be the acceleration down the pressure gradient? In
uniform units, the formula will become: