Environmental Engineering Reference
In-Depth Information
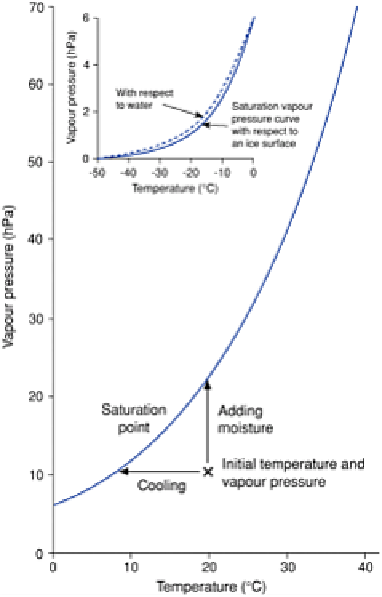
Figure 4.2
Saturation vapour pressure curve. Below 0° C the
curve is slightly different for an ice surface than for a
supercooled water droplet.
from the wet- and dry-bulb thermometers, using tables and pressure readings. The
relationship between temperature and the moisture content at saturation is indicated by
the saturation vapour pressure curve (Figure 4.2). Thus as a rising air bubble cools, it
approaches the temperature at which condensation occurs. When the air bubble reaches
that temperature it becomes saturated and net condensation takes place.
If condensation was the only thing that happened on saturation, then, apart from the
extra weight of the droplets, the effect on the air bubble would be small. There is,
however, another major effect. As water changes from its vapour state to a liquid it
releases latent heat. This heat acts to warm the air and thereby counteracts the cooling
resulting from expansion.
We can readily see the implications for our air bubble. Instead of cooling at 9·8°
C/1000 m (its dry adiabatic lapse rate), it cools more slowly as it rises. This new, lower
rate of cooling is known as the
saturated adiabatic lapse rate
(SALR). Unlike the dry
rate it is not a constant, for, as we can imagine, it depends upon the amount of heat
released by condensation, and that, in turn, depends upon the moisture content and hence
the temperature of the air. Warm air is able to hold a lot of moisture, and thus on cooling,