Biology Reference
In-Depth Information
0ab
c
0
200
150
Series 1
Series 2
100
50
0
w
0
20
40
60
80
100
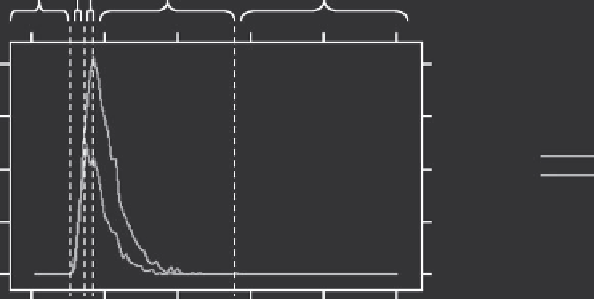
Figure 2.3
Data labeling.
outbreak signal starts, and hence the label is
a
. The outbreak signal reaches
its peak in series 2 on day 12 and in series 1 on day 14. The outbreak label for
days 12-14 is therefore
b
. Finally, on day 15, the number of cases decreases,
and the corresponding outbreak label is
c
.
Finally, we also allow for an outbreak to be generated and then modi-
fied according to the same effects (DOW, holiday, seasonal, etc.) as the
simulated background data. Such a modification is possible with simulated
background health data, as the parameters are unknown in actual data.
Although it is unknown whether outbreak signals are subject to the same
effects as the background health data, a reasonable assumption is that the
same reasons that keep people from showing up in no-outbreak scenarios
(weekend, weather, etc.) will affect them equally when they are sick due to
a “normal” cause or a “disease outbreak” cause.
2.5.2 Outbreak Signature Types
The outbreak signature simulation enables the user to generate two types
of signatures: a single-day (multivariate) spike and a multiple-day (multi-
variate) log-normal progression. As in the data simulator, we start with an
“initial” outbreak signature, and then add to it patterns such as seasonality,
DOW, and holidays.
To create the initial outbreak signature, one must set for each series
nout-
break
, the increase in the total number of cases throughout the outbreak man-
ifestation period (which can be thought of as the total number of cases added
due to the outbreak). Users can either manually define a vector of additional
cases for each series, or they can specify the increase in the series mean in
terms of a multiple of the standard deviation.