Biology Reference
In-Depth Information
The resulting
sts
object
momo
can now be accessed and manipulated using
standard matrix and data frame like access,
momo[1:10,“[0,1)”]
gives an
sts object containing the first 10 weeks of the <1 age group and
dim(momo)
returns the dimension of the momo time series (that is, 782 × 8). Other opera-
tions are the aggregation of the time series over several epochs or entities
by the
aggregate
function or linking the multivariate times series to geo-
graphical regions of an ESRI shapefile. Plot functions provide visualiza-
tion of the multivariate time series in time, space, and space-time. In the
subsequent analysis of the Danish mortality data, we focus on the country-
aggregated time series stratified by age. Here, age stratification is used to
differentiate between different mortality risk groups, and country level is
used to ensure sufficiently large strata in a population of 5.5 millions. For
larger EuroMOMO countries, a further stratification by geographical region
might, however, be relevant. The following code illustrates various uses of
the plot function for the momo object with corresponding output shown in
Figures 12.1 and 12.2:
500
500
500
500
(0,1)
(1,5)
(5,15)
(15,45)
300
300
300
300
100
100
100
100
0
0
0
0
2000
2004
2008
2000
2004
2008
2000
2004
2008
2000
2004
2008
Time (weeks)
Time (weeks)
Time (weeks)
Time (weeks)
500
500
500
500
(45,65)
(65,75)
(75,85)
(85,Inf)
300
300
300
300
100
100
100
100
0
0
0
0
2000
2004
2008
2000
2004
2008
2000
2004
2008
2000
2004
2008
Time (weeks)
Time (weeks)
Time (weeks)
Time (weeks)
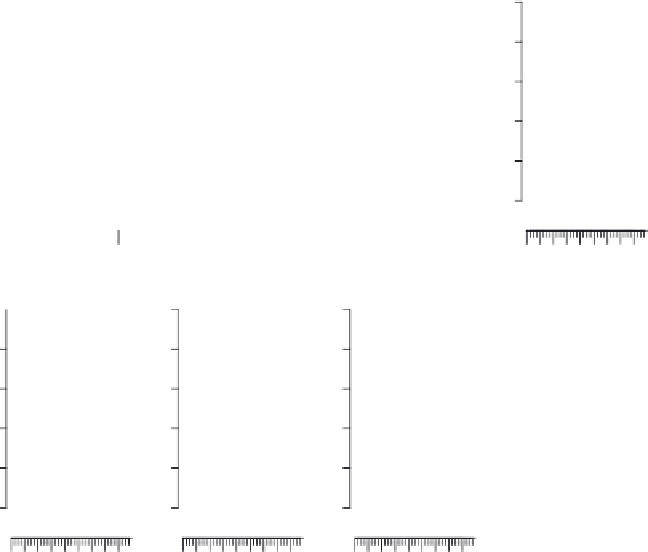
Figure 12.1
Weekly number of all-cause mortality in Denmark in the eight age groups during 2000-2008.
Each axis tick denotes a quarter (3-month period), and the larger tick marks denote the 1st
quarter of the year (starting with ISO week 01).


