Biology Reference
In-Depth Information
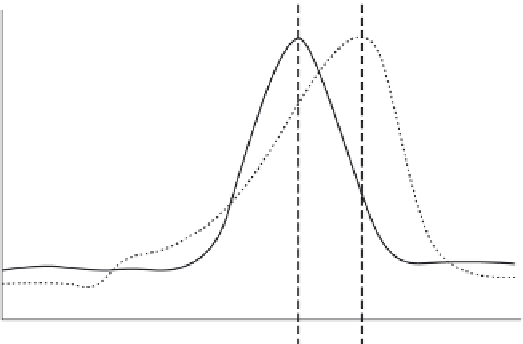
A
B
Time
Alert B
Alert A
Peak A
Peak B
Figure 1.2
Example of later peak and earlier alert in two data sources.
1.3. Aberration Detection
Biosurveillance algorithms typically operate in a binary fashion: on any given
day they either alert or they do not. An alert indicates that the data being
monitored has exceeded a threshold during an outbreak period. Operating
in this way, the performance of a detection algorithm in the context of a
particular data source can be characterized according to its timeliness (see
Box 1.2) (Buckeridge et al. 2005).
Aberration detection involves comparing the date of alert generated by
an algorithm based on one data source against the date of alert in another.
This method can be based on a simple threshold where an alert is gener-
ated when the time series exceeds a specific value (Davies and Finch 2003;
Irvin, Nouhan, and Rice 2003; Quenel et al. 1994). Historically, thresholds
have been based on two or three standard deviations above the mean (Irvin,
Nouhan, and Rice 2003), or arbitrary sales thresholds for OTC pharmaceuti-
cals (Davies and Finch 2003). This method is simple and able to detect shifts
in excess of the specified threshold rapidly (Lawson and Kleinman 2005).
However, it does not account for temporal features in the data, such as day-
of-week effects or seasonality.
More complex algorithms have been applied to influenza outbreaks and
include moving averages (Hogan et al. 2003; Ritzwoller et al. 2005), the scan
statistic and its variations (Ritzwoller et al. 2005; Yuan, Love, and Wilson
2004), and the cumulative sum (CUSUM) (Heffernan et al. 2004; Ivanov et al.
2003). Moving averages and CUSUMs are based on quality-control methods
that set an upper and lower control limit or threshold (Wong and Moore