Database Reference
In-Depth Information
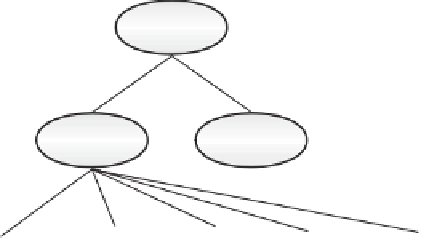
LRT
SQL CPU time
per SQL call
53 s/935,206
= 0.06 ms
SQL calls
935,206
114 s
SQL
Non
-SQL
Non-SQL CPU time
per SQL call
up to 49 s/935,206
= 0.05 ms
65 s
49 s
53 s
2 s
4 s
0 s
6 s
Wait for
prefetch
CPU time
Sync
read
Lock
waits
Other
waits
Figure 7.9
Unpromising culprit.
is a range predicate), the DBMS would scan the whole index if the user entered
a very old date.
Unpromising Culprits
The spike depicted in Figure 7.9 probably indicates a predominantly CPU-bound
sequential read (only 4-s Wait for Prefetch). The large number of SQL calls,
935,206, is bad news. Ideally, this number of SQL calls would imply that a
similar number of rows should be examined, at a cost of 0.1 ms per row (no
rows being rejected). The cost (absorbing the sequential touches within the cost
of the FETCH processing) would then be
935
,
206
×
0
.
1ms
=
93 s
Actually 93 s is higher than the measured CPU figure of 53 s; clearly the criteria in
place for this query differ somewhat from those on which our 0.1-ms performance
guideline figure is based. Nevertheless, this is the
minimum
cost of the SQL calls,
and so we can't make them any faster. Consequently, the only way to reduce
the SQL CPU time is to reduce the
number
of SQL calls. Sequential read may
then become I/O bound, so the elapsed time may not decrease by 90% even if
the number of SQL calls was reduced by 90%.
The high number of SQL calls also explains the large amount of non-SQL
time (49 s). A part of each SQL call is reported as non-SQL time on many
platforms. The 50 (49 s/935,206)
s between two successive SQL calls was
mostly due to this overhead (sending an SQL call and receiving the response from
the application program); the CPU time consumed by the application program,
written in PL/I, was certainly much less in this case.
µ


Search WWH ::

Custom Search