Biology Reference
In-Depth Information
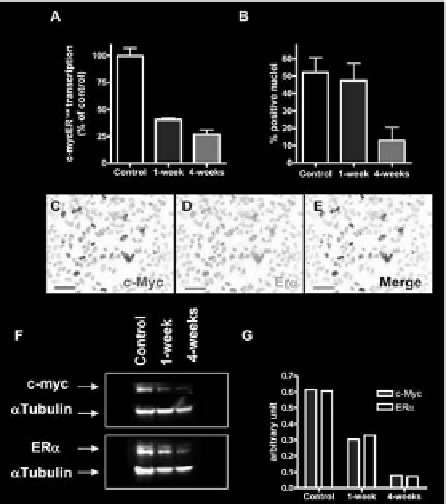
Analyses were carried out on control CTX0E03 cells and those cultured for 1-
and 4-weeks in the absence of growth factors and 4-OHT. In this non growth
permissive condition, transgene transcription was found to decrease by 59.6% at
1-week and 73.4% at 4-weeks relative to control by qRT-PCR (Figure 4A). Anal-
ysis of c-mycER
TAM
protein was performed by colocalization of c-Myc and ER
α
antigen staining by immunocytochemistry (ICC; Figure 4B, C, D, E). The c-Myc
and ER
α
antigens were always found to colocalize in the nucleus of a proportion
of CTX0E03 cells, indicating that the antibodies were detecting the c-mycER
TAM
target (Figure 4E). Immunoreactive cells were counted and expressed as a propor-
tion of total cells. These data showed control CTX0E03 cell cultures were ap-
proximately 52.0% positive for c-mycER
TAM
; whereas, following EGF, bFGF and
4-OHT withdrawal the number of CTX0E03 cells positive for c-mycER
TAM
were
42.5% at 1-week and 12.8% at 4-weeks (Figure 4B). Western blot analysis using
the c-Myc and ER
α
antibodies demonstrated that total c-mycER
TAM
protein levels
followed more closely the progressive drop observed by gene expression and were
reduced by 53.8% at 1-week and 73.0% at 4-weeks following EGF, bFGF, and
4-OHT withdrawal (Figure 4F, G).
Figure 4. In vitro characterisation of c-mycER
TAM
transcript and protein expression
. CTX0E03 cells were
cultured in growth medium (control) and in non-growth promoting medium (in the absence of growth factors
and 4-OHT) for 1- and 4-weeks. Evaluation of c-mycER
TAM
gene transcript and protein levels were performed
by qRT-PCR (A), ICC (B to E) and western blot (F). CTX0E03 cell ICC images shown in panels C to E are
representative images of the control c-Myc (green), ER
α
(red) and overlay (Merge). Scale bars represent 50
µ
m.
The western blots in panel F were quantified using densitometry normalised by
α
-tubulin (G).

Search WWH ::

Custom Search