Biology Reference
In-Depth Information
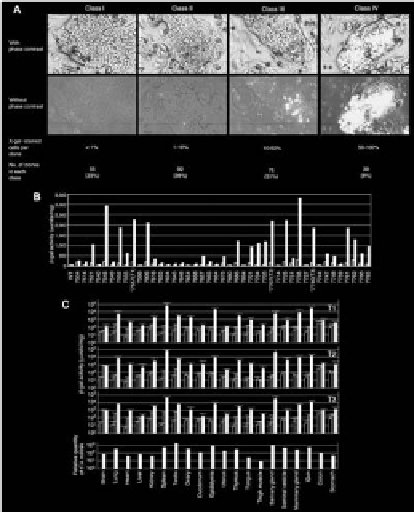
Optimal loci were initially screened in ES cells. The ES cell line used was
derived from CJ7 [10], of 129/Sv background. Following infection with the pR-
TonZ retroviral vector, G418-resistant (G418r) clones were stained with X-gal
(Figure 3A). Most clones showed mosaic staining pattern. By the percentage of
the X-gal-stained cell population, ES clones were classified into 4 categories (Fig-
ure 3A): class I (<1% of X-gal-stained cells) to class IV (>50% of X-gal-stained
cells). From 242 ES clones analyzed, 55 clones were classified into class I. Induc-
ibility was examined by
β
-galactosidase (
β
-gal) activity after transfecting 43 class
I clones with a tTA expression vector (Figure 3B). We set the cut-off value for
high induction level at 1500 µunits/mg of protein and nine clones belonged to
this category.
Figure 3. Characterization of gene regulation at TIGRE loci.
(A) Screening for optimal integration sites in ES
cells and classification of ES clones by X-gal staining. A representative ES clone is shown for each class with and
without phase contrast for better imaging of ES cell morphology and X-gal staining, respectively. (B) Screening
of class I clones for high inducibility. Forty three class I ES clones were transfected with a tTA expression
vector and
β
-gal activity was quantified 48 hours post-transfection. Bars: open, without tTA; filled, with tTA. A
luciferase expression vector was cotransfected to normalize
β
-gal activities. Three ES clones were designated as
T1, T2 and T3 as shown in the figure, and were used to generate mice. (C) Gene regulation in mice generated
from tightly regulated ES clones. Three mouse strains were established from ES clones T1, T2 and T3, and
crossed to MMTV-tTA mouse. Top three panels:
β
-gal activity was measured in the following three genotypes:
nontransgenic mice (lacZ(−)tTA(−), open bars); mice with lacZ gene but without tTA (lacZ(+)tTA(−), lightly
shaded bars); mice with both lacZ gene and tTA gene (lacZ(+)tTA(+), filled bars). Values are shown as means
with error bars of standard deviations from five male and five female animals. Values of nontransgenic mice
(open bars) are common in all three panels. Bottom panel: tTA mRNA expression level quantified by real-time
PCR from one male and one female mouse. Mean values are presented by filled bars. Note that values are shown
in logarithmic scale.

Search WWH ::

Custom Search