Environmental Engineering Reference
In-Depth Information
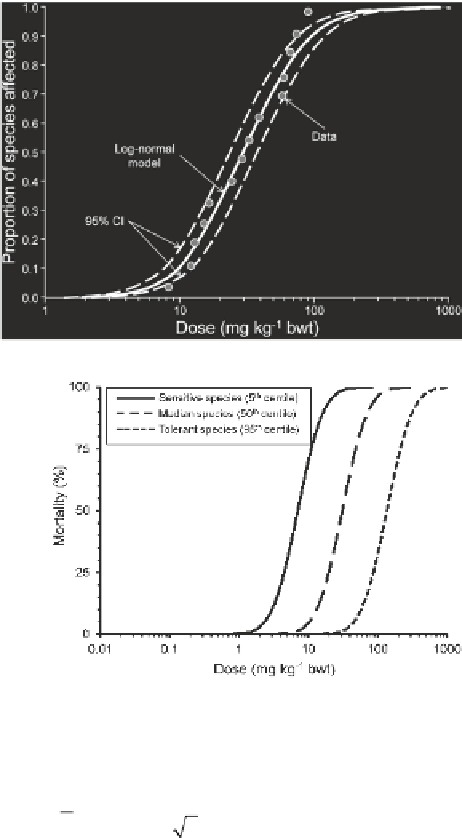
Fig. 6
Species sensitivity
distribution for bird species
exposed to chlorpyrifos via
oral gavage exposure
Fig. 7
Hypothetical acute
dose-response curves for
sensitive, median and tolerant
bird species
models tested (Anderson-Darling A
2
= 0.301,
p
> > 0.1). The model equation for the
two-parameter log-normal cumulative distribution function (CDF) is shown below (
2
):
()
=+
-
1
2
æ
ç
e f
x
m
ö
÷
æ
ç
ö
÷
fx
1
( 2 )
s
2
Where:
x
is the LD
50
(log mg ai kg
−1
bwt), and the functional response,
f
(
x
), is the
proportion of species affected. The location and scale parameters,
, are the
mean and standard deviation of the dataset, respectively, and
erf
is the error function
(i.e., the Gauss error function).
μ
and
σ
Graphical and statistical tests indicated that the homogeneity of variance and
normality assumptions of the parametric regression analysis were met. The fi tted
model parameters were:
= 0.391 (Fig.
6
). The 5th, 50th and 95th cen-
tile LD
50
s from the best-fi t SSD are respectively 7.03, 30.9 and 136 mg ai kg
−1
bwt.
These values were combined with the geometric mean probit slope of 3.45 (Table
4
)
to generate the hypothetical dose-response curves for avian species of high (5th
centile), median (50th centile) and low (95th centile) sensitivity (Fig.
7
).
μ
= 1.49 and
σ
Search WWH ::

Custom Search