Environmental Engineering Reference
In-Depth Information
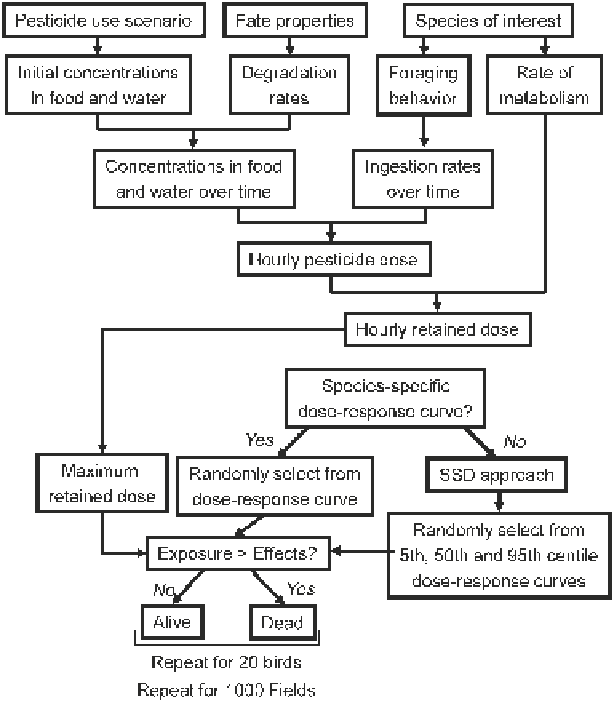
Fig. 4
Components of LiquidPARAM
quantify the relationship between dose and proportion species affected as determined
by their LD
50
s. Hypothetical dose-response curves are then derived for species
of high (5th centile species on the SSD), median (50th centile species) and low
(95th centile species) sensitivity. The 5th, 50th and 95th centile LD
50
s are combined
with the average slope for tested bird species to parameterize the three hypothetical
dose-response curves assuming an underlying log-probit distribution. Section
5
describes the assessment of acute effects in detail.
For chronic exposure, total daily intake (TDI) is estimated for each day in the
60-d model run. TDI is averaged over a period equal to the duration from which the
most sensitive effects metric was derived (e.g., gestation period for number of eggs
laid). The maximum rolling average from the 60-d model run for each bird is then
compared to a randomly drawn TDI from the appropriate chronic dose-response
curve, if available, to determine if the bird is adversely affected and, if so, magnitude
of effect. In the absence of a chronic dose-response curve, as is the case for CPY,
Search WWH ::

Custom Search