Environmental Engineering Reference
In-Depth Information
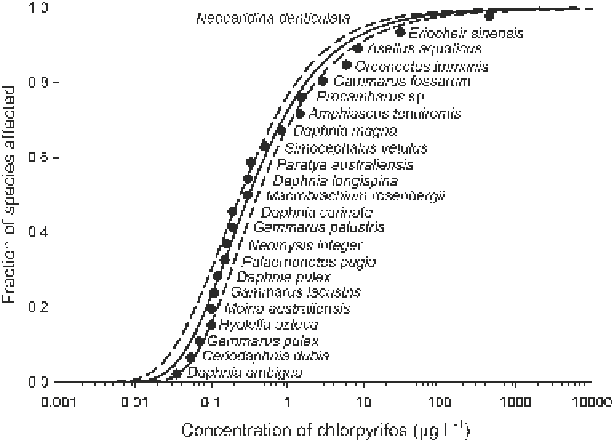
Fig. 3
Species Sensitivity Distribution (SSD) for chlorpyrifos in crustaceans.
Solid line
is the
fi tted Gumbel model.
Dashed lines
represent 95% confi dence interval
would be affected by environmentally-relevant concentrations of CPY and that
indirect effects would occur higher in the food web. Thus, protection of these other
components of the food web would also be protective of plants in general and
phytoplankton in particular.
Crustacea
. Data for toxicity of CPY from 23 species of crustaceans met the criteria
for inclusion in the analysis (Table
2
). The range of LC
50
s was from 0.035 to 457
g
CPY L
−1
. The model for the cumulative frequency distribution (CFD) with the best
fi t was the Gumbel (SI Table
4
, SI Fig.
1
) and the SSD is shown in Fig.
3
. The HC5
(95%CI) was 0.034 (0.022-0.051)
μ
μ
g CPY L
−1
(SI Table
4
).
Insects
. Toxicity data for CPY from 17 species of aquatic insects met the criteria for
inclusion in the analysis (Table
2
). The range of LC
50
s was from 0.05 to >300
g
CPY L
−1
. Two values were reported as “greater than” and were included in the cal-
culations of the ranks for constructing the SSD (Fig.
4
). The Extreme Value model
gave the best fi t for the CFD (SI Table
4
), but visual inspection of the plots of the
various models showed that the fi t in the lower tail was better for the Gumbel model
(SI Fig.
1
). The lower tail is where exceedences are more likely and, for this reason
and for consistency with the other taxa, this model was used. The HC5 (95%CI) was
0.087 (0.057-0.133)
μ
μ
g CPY L
−1
(SI Table
4
).
Fish
. Data for toxicity of CPY from 25 species of fi sh met the criteria for inclusion
in the analysis (Table
2
). One value reported as “greater than” was included in the
calculations of the ranks for constructing the SSD (Fig.
5
). The model that exhibited
the best CFD fi t was Gumbel (SI Table
4
and SI Fig.
1
). The range of LC
50
s was
Search WWH ::

Custom Search