Information Technology Reference
In-Depth Information
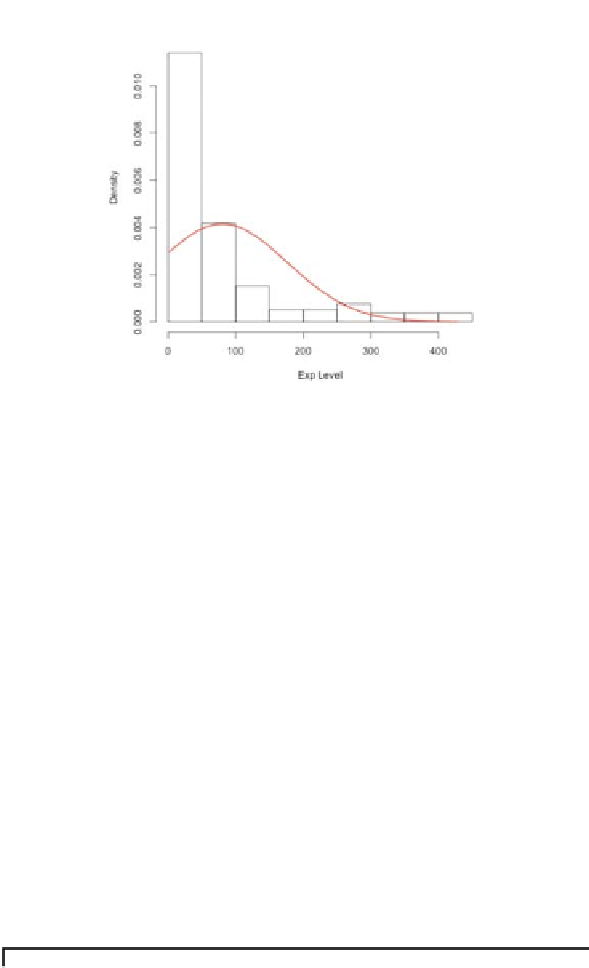
NORMAL
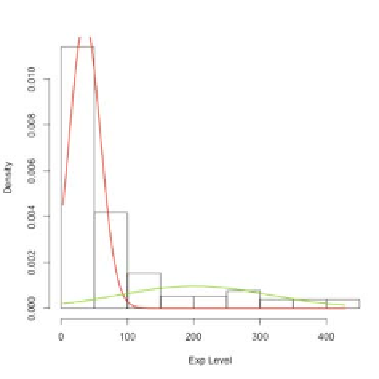
Fig. 3.
The components (one and two) of mixture models of normal distribution fit to
the marginal distribution of the CSN3 gene is shown
Table 3.
Loglikelihood,
D
and p-value, averaged over each probe of the GDS592
dataset
Normal
Lognormal
Gamma
#Comp Loglik
D
p-value Loglik
D
p-value Loglik
D
p-value
1
-728.47 1.14e-3
0.99
-85.04 7.70e-5
0.99
-492.66 1.72e-3
0.99
2
-683.53 1.44e-3
0.99
-47.39 7.73e-5
0.99
-437.79 1.05e-3
0.99
3
-661.46 2.70e-3
0.99
-46.64 9.20e-5
0.99
-487.58 1.26e-3
0.99
4
-637.21 5.79e-3
0.97
-46.01 6.17e-5
0.99
-474.41 1.19e-3
0.99
5
-612.37 9.44e-2
0.88
-45.08 7.45e-5
0.99
-465.15 8.36e-4
0.99


Search WWH ::

Custom Search