Information Technology Reference
In-Depth Information
3.3 Estimating Significance in FC-GSEA
To estimate the statistical significance of an observed ES for a gene-set, it needs to be
compared with the set of scores ES
NULL
computed with randomly permutated samples
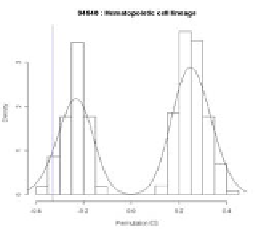
with respect to sample labels. In original GSEA, a null distribution of ES is like Fig. 8.
In Fig. 8, the left graph shows the case of locating an observed ES in a positive region
while the right graph shows the case of locating an observed ES in a negative region.
Also the bold-lined vertical bar indicates the location of an observed ES and the x axis is
the permutation ES.
Fig. 8.
An example of a null distribution of ES in original GSEA
In above cases, the estimation of significance for a gene-set is made with an ob-
served ES whether it is in a positive region or in a negative region. If the observed ES
is in a positive region, the positive portion of the distribution greater than the ob-
served ES is used to estimate a nominal p-value for a gene-set. If the observed ES is
in a negative region, the negative portion of the distribution less than the observed ES
is used to estimate a nominal p-value.
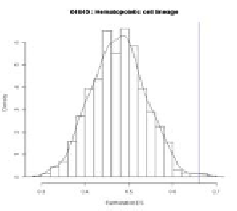
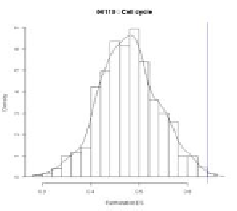
On the other hand, in FC-GSEA, an observed ES is always located in a positive re-
gion. Thus, a null distribution of ES in FC-GSEA is like Fig. 9. Here the left (the
right) graph corresponds to the case of having an observed ES in a positive (negative)
region in original GSEA. As shown in Fig. 9, in either case, since an observed ES is
always in a positive region for FC-GSEA, the positive portion of the distribution
greater than the observed ES is used to estimate a nominal p-value for a gene-set.
Thus, in order to identify significant gene-sets, one tailed test is performed in FC-
GSEA while two-tailed test is performed in original GSEA.
Fig. 9.
An example of a null distribution of ES in FC-GSEA

Search WWH ::

Custom Search