Database Reference
In-Depth Information
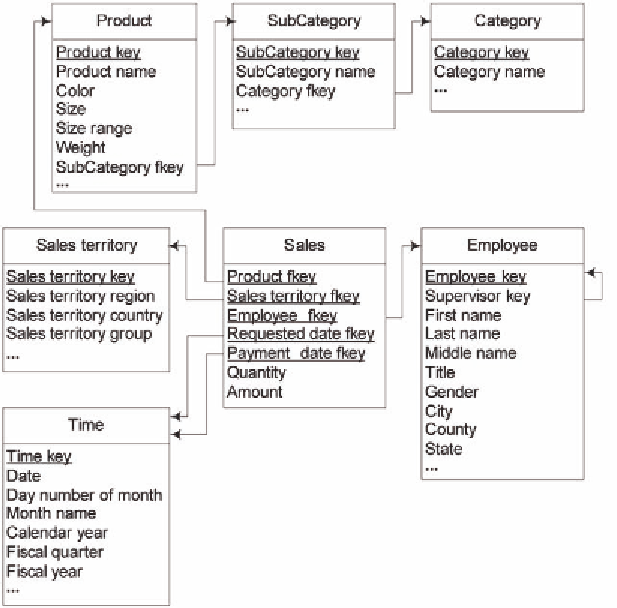
Figure 1. Example of a DW for analyzing employees' sales
1) represents the focus of analysis (e.g., analy-
sis of employees' sales) and typically includes
attributes called
measures
. These are usually
numeric values (e.g.,
Quantity
and
Amount
in
Figure 1) that facilitate a quantitative evaluation
of various aspects of interest.
Dimensions
(e.g.,
Sales territory
in Figure 1) are used to see the
measures from different perspectives, e.g., ac-
cording to geographic distribution of a company.
Dimensions typically include attributes that form
hierarchies
. When a hierarchy is traversed from
finer to coarser levels, measures are aggregated,
e.g., moving in a hierarchy from a product to a
subcategory will give aggregated values of sales
for different products subcategories.
Hierarchies can be included in a flat table (e.g.,
attributes
City
-
County-State
in the
Employee
table
in Figure 1) forming the so-called
star schema
or
using a normalized structure (e.g., tables
Product
,
SubCategory
, and
Category
in the figure), called
the
snowflake schema
.
In order to exploit OLAP systems to their
fullest capabilities hierarchies must be clearly
defined. Hierarchies are important in analytical
applications, since they represent data at differ-
ent abstraction levels. However, in real-world
situations, users must deal with different kinds
of hierarchies that either cannot be represented
using the current DW and OLAP systems or are
represented at the logical level without the pos-
sibility of capturing the essential semantics of
multidimensional applications. For example, the
Employee
table includes a hierarchy that repre-
sents the supervisor-supervisee relationship (the
attributes
Employee key
and
Supervisor key
); this
hierarchy is difficult to distinguish even though it
may be important to consider during the analysis
process.Another hierarchy in the same table can be
Search WWH ::

Custom Search