Database Reference
In-Depth Information
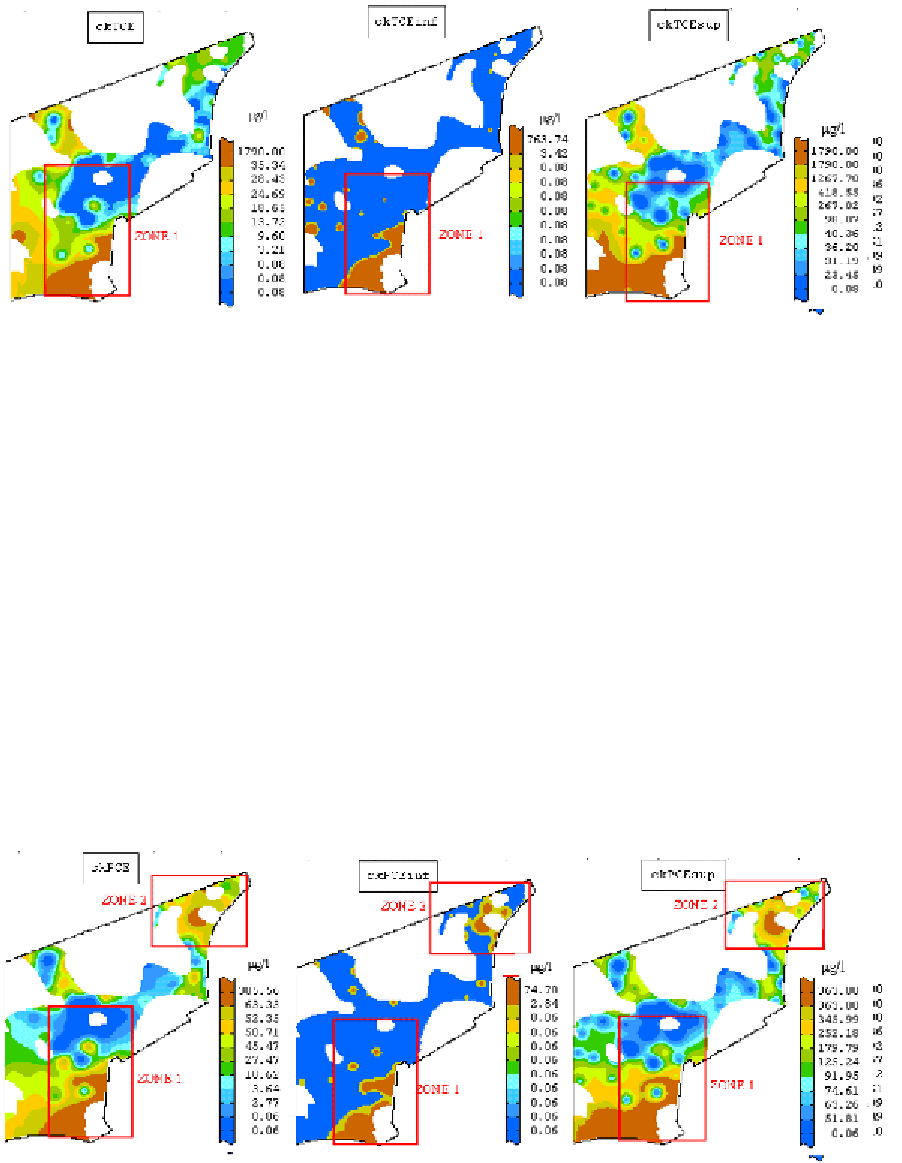
Figure 9. Maps of cokrigged TCE concentration in the mean, in the best and in the worst scenario of
potential contamination (spot area highlighted) (modif. from Castrignanò et al, 2007)
Source Representative Concentration value in
correspondence of the source of pollution in
groundwater. The examined approaches are:
of the Source Representative Concentration
on the basis of the representative UCL val-
ue obtained from the estimated values of
the variable inside this area.
• III approach: for defined values of proba-
bility of exceeding the CSC of the variable,
the most vulnerable areas are delimited; the
Source Representative Concentration val-
ues for each defined area are determined as
representative UCL values obtained from
the estimated values of the variable inside
each area.
•
I approach: elaborations carried out follow-
ing the classical risk assessment approach,
according to the indications of ARPA
Manual (2008) and the software ProUCL
(U.S. EPA, 2007).
•
II approach: area delimited by the isochon
(CSC) of 10µg/l, obtained by means of geo-
statistical interpolation and determination
Figure 10. Maps of cokrigged PCE concentration in the mean, in the best and in the worst scenario of
potential contamination (spot areas highlighted)(modif. from Castrignanò et al, 2007)
Search WWH ::

Custom Search