Database Reference
In-Depth Information
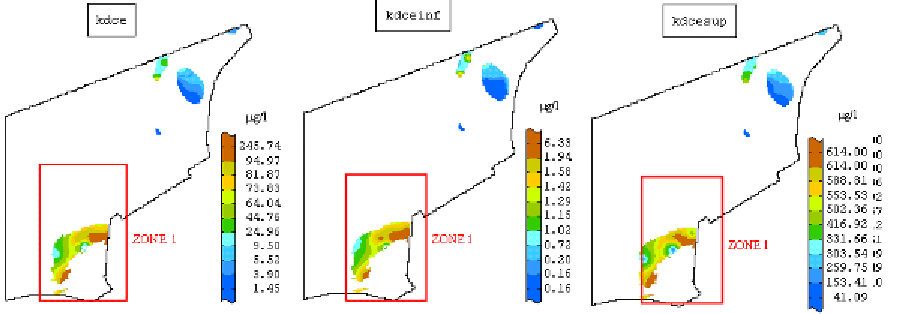
Figure 8. Maps of krigged cDCE concentration in the mean, in the best and in the worst scenario of
potential contamination (spot area highlighted) (modif. from Castrignanò et al, 2007)
obtain three different scenarios for the areas: the
mean, the best, and the worst scenario of potential
contamination. The high differences in the absolute
values of concentration, shown in the three maps,
remark the necessity to follow a probabilistic ap-
proach (confidence interval) in the classification
process of potentially polluted areas, which takes
into account the prediction uncertainty.
Synthesizing the information obtained through
the interpolation of the considered substances, it is
possible to conclude observing that two principal
spot areas can be identified; one more northern
(Zone 2), the other one more southern (Zone 1),
which suggest the presence of two centers of
hazard (Castrignanò et al., 2007).
In many environmental applications, as in the
two case studies presented, a few random hot spots
of large concentrations coexist with a background
of small values that vary more continuously in
space (Goovaerts, 1999). A way to attenuate the
impact of these extreme values is to use robust
statistics and estimators such as the non parametric
approach of indicator kriging. The application of
this approach can also account for secondary data
through a soft indicator coding of information, as
done in the first case study.
case Study III: comparison
of different Approaches
In this study different geostatistical elaborations
have been carried out for the determination of the
dimension of the Source Representative Area and
Concentration and the achieved results have been
compared with the ones obtained by a classical
deterministic approach. The case study regards
a dismissed industrial area located in Apulia, for
which an analysis has been carried out for the
determination of the risk in relation to ground-
water contamination by arsenic. The analysis has
pertained to the determination of the potentially
contaminated area and the individuation of the
conclusion
The application of indicator kriging in presence of
censored data has proved to be a useful tool for the
interpretation of the physical processes controlling
contamination and therefore in decision-making
processes, such as delineation of hazardous areas.
In the study case, the application of this proce-
dure has allowed to identify two principal spot
areas which suggest the presence of two centers
of hazard.
Search WWH ::

Custom Search