Database Reference
In-Depth Information
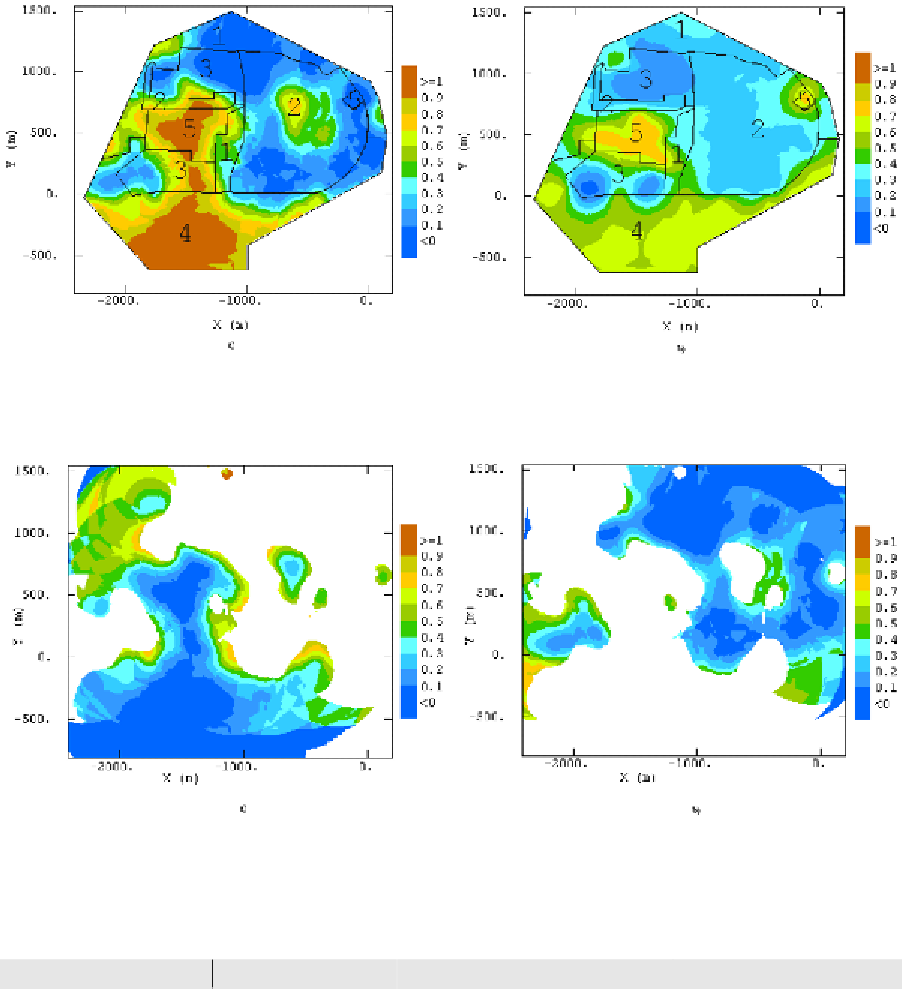
Figure 4. a) Probability map of arsenic exceeding the compulsory threshold b) Marginal probability map
of arsenic exceeding the threshold relatively to each area (modif. from Castrignanò et al, 2004)
Figure 5 Contoured map of the risk α (a) and β (b) (modif. from Castrignanò et al, 2004)
Table 1. Marginal proportions of exceeding the critical value of 10 μg/l, relatively to each homogeneous
area (Castrignanò et al, 2004)
Homogeneous Areas
N. of Piezometers
Samples exceeding threshold
Exceedance Proportion
Area 1
18
7
7/18=0.38
Area 2
24
6
7/25=0.24
Area 3
20
5
5/20=0.16
Area 4
20
12
12/20=0.60
Area 5
12
9
9/12=0.75
Σ = 94
Σ = 40


Search WWH ::

Custom Search