Database Reference
In-Depth Information
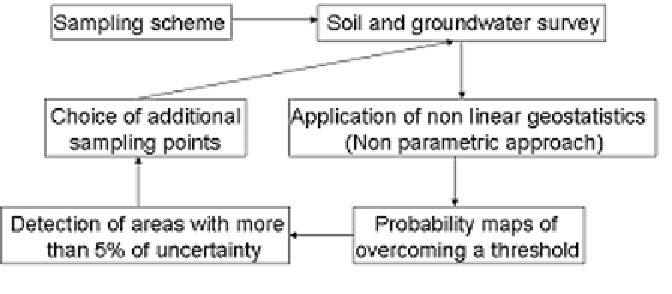
Figure 2. geostatistics within the process of characterization and monitoring
required to complete the sampling procedure
(Castrignanò, 2008).
polluted (or potentially polluted) zones generally
the areas with a probability higher than 5% of ex-
ceeding the CSR (or CSC) values are delineated.
As it is highly improbable that parts of the areas
with low probability of exceeding this value are
polluted, these are excluded from further sampling.
In this way both the geostatistical (reduction of
the estimation variance) and the field knowledge,
both fundamental in the planning phase, increase
progressively during the sampling, in contrast to
the case of non-interactive procedures in which
the data can be evaluated just “a posteriori”, once
all samples have been conclusively collected.
Garcia and Froidevaux (1997) used as a
measure of uncertainty the absolute difference
between the probability of exceeding the critical
threshold z
k
and the closest of the two low and
high risk probability thresholds 0.2 and 0.8; they
considered that the uncertainty is negligible at
locations where the probability of contamination
is either high (>0.8) or low (<0.2). This method
doesn't take into account the uncertainty in the
predictions of the site-specific threshold zk.
Van Meirvenne & Goovaerts (2001) proposed
as a sampling criterion the ratio of the standard
deviation to the absolute value of the mean of the
local cumulative distribution of the difference
(D(u)) between the pollutant concentration and
the threshold:
Monitoring
The evolution of the level of contamination in an
area has to be monitored in time, in such a way as
to guarantee that the temporal trend of pollutant
concentrations corresponds to what was planned
in the remediation project.
The application of geostatistics permits to
define the degree and geometry of regionalization
of the pollutants in a specified area and represents
therefore a useful tool during the monitoring phase
for planning data sampling in order to maximize
the information at parity of costs.
The block diagram in Figure 2 schematizes this
procedure. Once completed the monitoring of the
area by means of soil and groundwater survey, the
application of non parametric geostatistics permits
to determine the probability maps of overcom-
ing a specified threshold. The delineation of that
portion of the area characterized by a probability
higher than 0.05 that the concentration values of
the study variable exceed a given threshold of
intervention (both the CSC for the delimitation of
the potentially contaminated areas and the CSR for
the delineation of the areas to remediate) proves
to be a useful tool to determine further points in
which to intensify the sampling. In order to predict
Search WWH ::

Custom Search