Database Reference
In-Depth Information
data Sets
of WT-TTR along the five MD unfolding simu-
lations. Each data set, named Run 1 to Run 5, is
stored in a different file structured in a tabular
fashion, with columns identifying residues, and
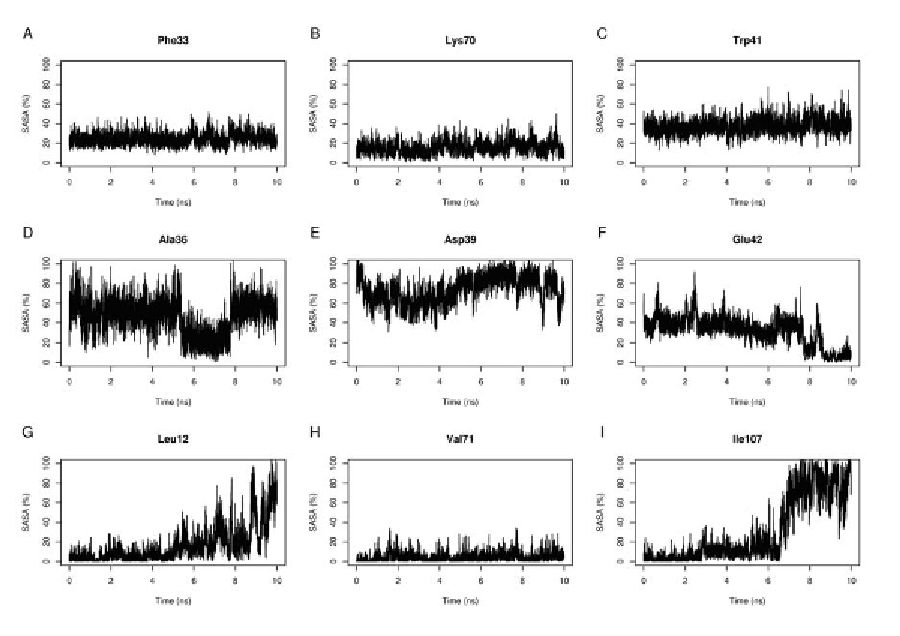
rows representing time frames. Figure 3 shows
the SASA behaviour of nine amino-acid residues
across different MD unfolding simulations of WT-
TTR. We can point out that, although different
SASA profiles are observed, some residues have
the same SASA profiles in the same simulation
(Panels A and C), or in different simulations
(Panels A and B).
Five independent MD unfolding simulations of
W T- TTR were studied. The monomer of WT-TTR
has 127 amino-acid residues, and each simula-
tion is represented by a trajectory constituted by
10,000 time frames (one frame per picosecond
simulated). Thus, for each simulation a data set
was generated comprising 127 SASA time series,
one per residue, with 10,000 time points each.
Overall, we analysed five data sets reflecting the
SASA variation of the 127 amino-acid residues
Figure 3. Variation of the solvent accessible surface area (SASA) of different residues along multiple
MD unfolding simulations of WT-TTR. Representative SASA profiles of nine residues are shown. The
data plotted is originated from different data sets. The profiles for residues Leu12 and Glu42 are cal-
culated from simulation 1, while Ala36 and Val71 depict data from simulation 2. Residues Phe33 and
Trp41 were plotted with data from simulation 3, whereas the data from simulation 4 was used to plot
the SASA profile of residues Asp39 and Ile107. Finally, data from simulation 5 was used to describe the
behaviour of Lys70

Search WWH ::

Custom Search