Database Reference
In-Depth Information
of the site go through a staggering popularity
growth phase, thus anticipating voluminous user
requests for particular content items.
The temporal data appearing within a book-
marking system are usually generated by means
of recording event timestamps; specifically, the
set of instances when a story collects votes from
users constitute the popularity timeline of the
particular story (cf.
π
T
(
H
r
) of Definition 3) and
the instances when a user gives votes to stories
form his/her activity timeline (cf.
π
T
(
D
u
) of Defini-
tion 2). For convenience, we will denote the raw
timestamp set comprising the event instances of
object
i
(where
i
can either denote a story or a
user) in an ordered fashion as
T
i
= {t
0
, t
1
.... t
N
}
.
The first step in analyzing such data is to select
a small but sufficiently representative subset of
stories or users and then to inspect their timestamp
sets on an individual basis.
However, these timestamp sets are not time
series in a typical sense, i.e. they are not the result
of measuring the value of a variable at regular
intervals. Thus, in order to visually convey the
information contained in them in a meaningful
way, we consider two kinds of time series based
on these raw timestamp sets: (a) the time series
of the aggregate count of events at time
t
, and
(b) the time series of the count of events falling
in the interval
[t-Δt, t+Δt]
. For ease of reference,
we shall denote the aforementioned time series
as
N(t)
and
n(t)
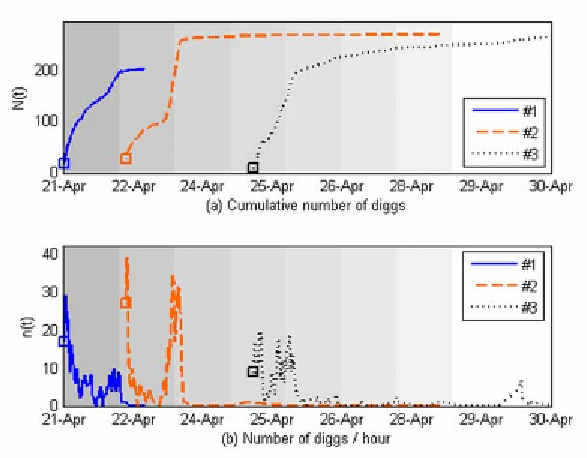
respectively. Figure 1 illustrates
the characteristics of such time series for a small
sample of Digg story popularity time series.
A complication arises when attempting to
study the temporal behavior of numerous SBS
entities (stories or users) in an aggregate manner:
The entities of interest are active in different time
intervals and have different activity rates. In order
to overcome this complication, we consider the
projection on
T
of the Vote-history set
H
r
, denoted
by
T
r
=
π
T
(
H
r
). For each story, we perform the
following transformation:
T
-
min(
T
)
T
=
r
r
r
max(
T
)min()
-
T
(3)
r
r
Figure 1. Two alternatives for inspecting event-based time series: (a) cumulative number of Diggs, (b)
number of Diggs per hour. Here, three sample Digg story popularity curves are shown
Search WWH ::

Custom Search