Database Reference
In-Depth Information
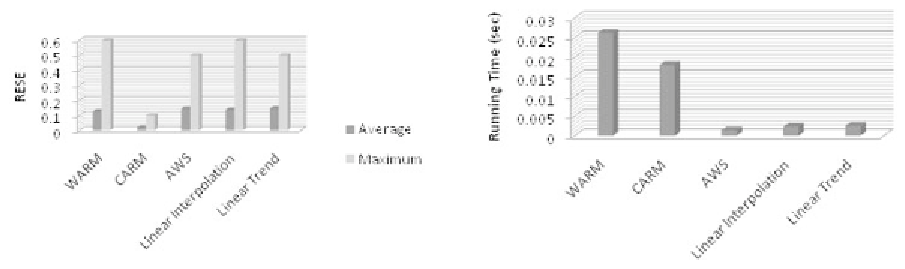
Figure 5. Performance study of average and
maximum estimation accuracy
Figure 6. Performance study of running time
Performance Study of Memory Usage
out more of the relationships between the existing
sensors. Also from this figure, we can see that
the CARM approach provides better estimation
accuracy than the WARM approach does. This is
because CARM performs the estimation based on
the associations from multiple sensors derived by
a compact and complete set of information, while
WARM performs the estimation based on the
associations derived by two sensors as frequent
patterns in the data structure.
Figure 7 illustrates the memory usage of AWS,
linear interpolation, linear trend, WARM and
CARM approaches in the proposed framework.
The experimental results show that in terms of
memory space, the WARM approach is outper-
formed by all other four approaches. The results
of the simulation experiments show that for all
processed sensors the needed memory space using
WARM, is higher than that using CARM. This is
because the lattice data structure in CARM uses
less memory space than the cube data structures
in WARM, and it stores only the condensed closed
patterns. And for the AWS, linear interpolation,
and linear trend approach, they only need to store
and process information regarding the missing
sensor's readings.
Performance Study of Running Time
Figure 6 illustrates the running time in seconds of
AWS, linear interpolation, linear trend, WARM
and CARM approaches in the proposed frame-
work. The experimental results show that in
terms of running time, the WARM and CARM
approach are outperformed by AWS, linear inter-
polation and linear trend approaches. The CARM
approach is faster than the WARM technique.
This is because in the AWS, linear interpolation,
linear trend approaches, the calculation is based
on relationships in a certain sensors reading trend,
while for WARM and CARM the calculation is
based on relationships between not only the miss-
ing sensors previous readings but also the other
sensors' readings that related with the missing
sensor reading.
Figure 7. Performance study of memory usage

Search WWH ::

Custom Search