Information Technology Reference
In-Depth Information
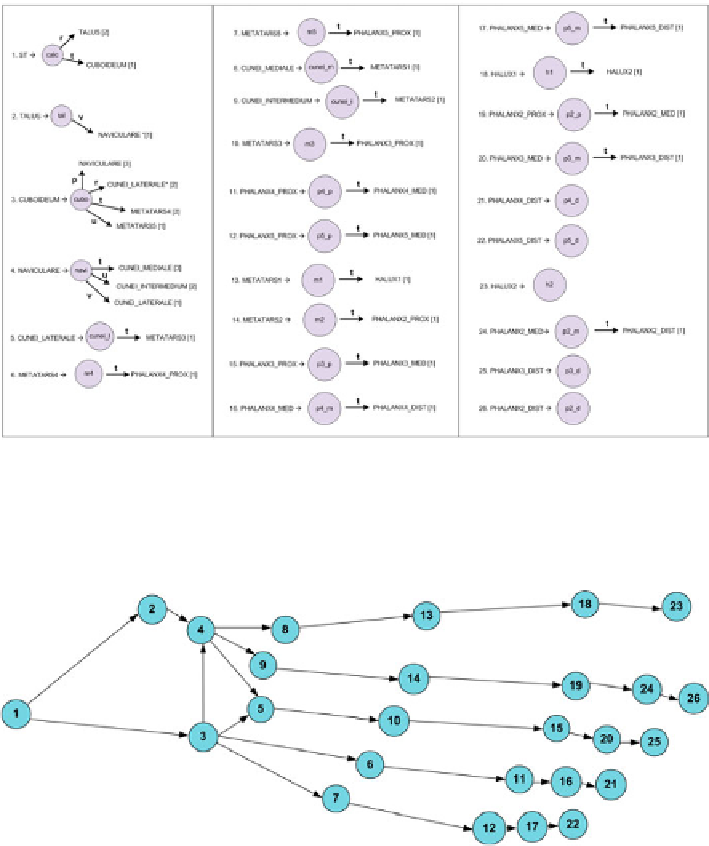
Fig. 5.5.
Set of productions
P
Figure 5.6, in turn, shows the graph of relations between individual tarsus,
metatarsus and phalanx bones.
Fig. 5.6.
The graph of relations between individual foot bones
Figure 5.7 shows the graph of relations between individual foot bones including
the angles of slopes between them.
This definition method allows the UBIAS system to start analysing image data.
Selected results of its operation are illustrated by Figures 5.8-5.12, which show the
universality of the analysis using various selected examples of automatic image
data interpretation and its semantic interpretation.