Chemistry Reference
In-Depth Information
tAble 4.4
measurement of reproducibility
Amount
lab one
lab two
Mean
26.0 mg
25.6 mg
Std. Dev.
0.12 mg
0.24 mg
%RSD
0.46
0.94
%Difference (means)
1.53
Acceptance criteria (RSD)
≤2%
Assessment
Pass
130.00
Acceptance criteria
120.00
Confidence interval
110.00
Individ. data pts.
100.00
Mean % recovery
90.00
80.00
70.00
0.0
1.0
2.0
3.0
4.0
5.0
Level
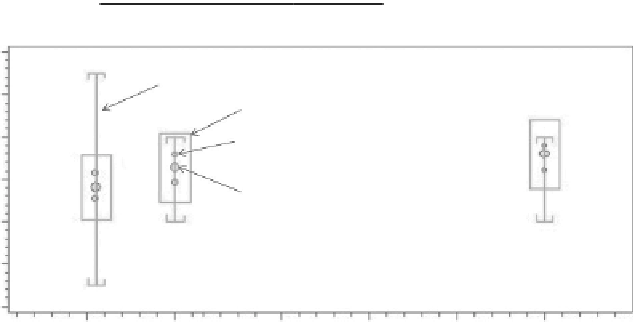
FIgure 4.3
An example of a chromatography data system Whisker plot, a common way
of documenting precision and accuracy. The box represents the upper and lower confidence
intervals, the whiskers with up-tics and down-tics represent the user-defined upper and lower
acceptance criteria. The small points are the individual data points of percent recovery (at each
concentration level); the large points are the mean percent recovery at each concentration level.
different HPLC system to evaluate the sample solutions. Each analyst successfully
attained the precision requirements of ≤2% RSD, and the percent difference in the
mean values between the two analysts was 1.53%, indicating that there is no differ-
ence in the mean values obtained (Student's
t
-test,
P
= 0.01). Figure 4.3 gives addi-
tional examples of measuring and documenting precision at various levels.
4.3.2.4 ruggedness
Ruggedness
was defined in past USP guidelines as the degree of reproducibility
of test results obtained by the analysis of the same samples under a variety of con-
ditions, such as different laboratories, analysts, instruments, reagent lots, elapsed
assay times, assay temperature, and days. It is a measure of the reproducibility of
test results under the variation in conditions normally expected from laboratory to
laboratory and from analyst to analyst. The use of the term
ruggedness
, however, is