Biology Reference
In-Depth Information
Control
12
Captopril
10
Tamoxifen
α
8
6
4
2
0
CG
TDW
TDG
TSW
TSG
CW
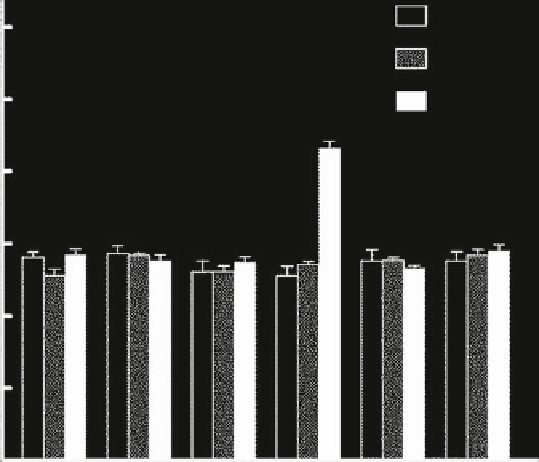
Fig. 8.2
Comparison of fasting blood glucose concentrations among groups (
CW
control with
water intake alone,
CW + Cap
CW plus captopril treatment,
CW + Tam
CW plus tamoxifen treat-
ment,
CG
control with high sugar intake,
CG + Cap
CG plus captopril treatment,
CG + Tam
CG
plus tamoxifen treatment,
TDW
perinatal taurine depletion with water intake alone,
TDW + Cap
TDW plus captopril treatment,
TDW + Tam
TDW plus tamoxifen treatment,
TDG
perinatal taurine
depletion with high sugar intake,
TDG + Cap
TDG plus captopril treatment,
TDG + Tam
TDG plus
tamoxifen treatment,
TSW
perinatal taurine supplementation with water intake alone,
TSW + Cap
TSW plus captopril treatment,
TSW + Tam
TSW plus tamoxifen treatment,
TSG
perinatal taurine
supplementation with high sugar intake,
TSG + Cap
TSG plus captopril treatment,
TSG + Tam
TSG
plus tamoxifen treatment;
a
p
< 0.05 compared to all other groups)
were similar to those of CW of same treatment. High sugar intake in TSG did not
significantly increased insulin secretion, but it was slightly and significantly elevated
by captopril (but not tamoxifen) treatment. The rise in insulin secretion in response
to RAS inhibition was much higher in TDG compared to all other groups.
The patterns of estimated insulin resistance (estimated by HOMA1-IR;
HOMA1-IR = blood sugar × plasma insulin/22.5; Fig.
8.6
) paralleled the plasma
insulin data (Fig.
8.4
), except in the TDG group in which insulin resistance was
significantly increased by tamoxifen when compared to control TDG, TDW + tam,
and CG + tam groups.
8.4
Discussion
Perinatal taurine depletion leads to low birth weight of the pups which subse-
quently develop several disorders in adulthood, including diabetes mellitus
(Aerts and Van Assche
2002
). Conversely, taurine supplementation can prevent
Search WWH ::

Custom Search