Biology Reference
In-Depth Information
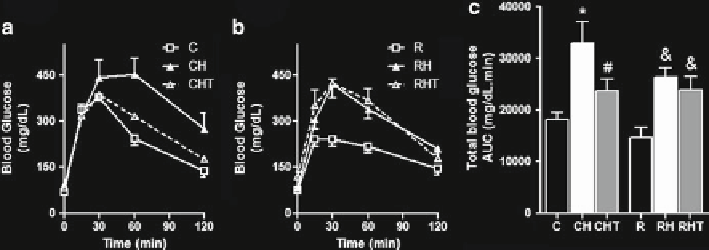
Fig. 10.2
Glucose tolerance test (GTT). (
a
) Groups C, CH, and CHT; (
b
) groups R, RH, and RHT;
(
c
) area under curve.
Bars
represent means ± SEM of the area under curve. *
p
< 0.05 compared to
C, # compared to CH, and compared to R.
N
= 6
Fig. 10.3
Food intake (Kcal/
dia) of C, CH, CHT, R, RH,
and RHT mice. Values are
mean ± SEM. *
p
< 0.05
compared to C, # compared
to CH, and compared to R
groups.
N
= 7
10.4
Discussion
Fetus that underwent a protein restriction in utero showed poor islet vasculariza-
tion as well as increased apoptosis (Snoeck et al.
1990
; Boujendar et al.
2002
) .
Rats submitted to protein restriction during gestation become diabetic at 17
months of age (Petry et al.
2001
). In addition these rodents showed neuroendo-
crine and sympathetic action alterations, changing growth hormone (GH)-insulin-like
growth factor I (IGF-I) axis (Heilbronn and Ravussin,
2003
) . Our results indicate
an increase of adiposity and glucose intolerance in malnourished mice submitted
to HFD. These evidences demonstrate that fetal and early life stages are critical
periods where nutrient deprivation may provoke long-lasting effects favoring dis-
eases in adult life.
Previous reports showed that TAU plasma concentrations are reduced in differ-
ent types of experimental obese rodents. TAU supplementation prevented body
weight gain and adiposity induced by HFD (Tsuboyama-Kasaoka et al.
2006
) .

Search WWH ::

Custom Search