Biology Reference
In-Depth Information
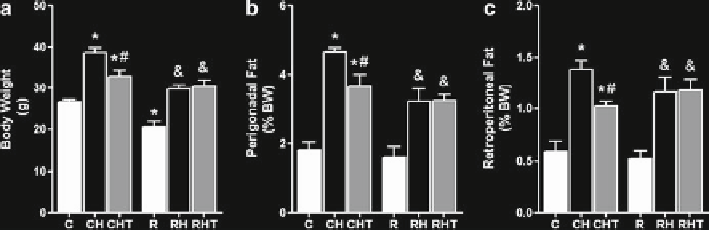
Fig. 10.1
(
a
) Body weight; (
b
) retroperitoneal and (
c
) perigonadal fat pads in C, CH, CHT, R, RH,
and RHT mice. Values are means ± SEM. *
P
< 0.05 compared to C, # compared to CH, and com-
pared to R.
N
= 6-12
10.3
Results
10.3.1
Mice Features
The low-protein diet promoted lower body weight in R mice compared to C (
P
< 0.05;
Fig.
10.1a
). HFD increased BW as well as perigonadal and retroperitoneal fat pads
(
P
< 0.05; Fig.
10.1a-c
). TAU supplementation prevented obesity and adiposity in
CHT but not in RHT group. HFD treatment also increased fasting plasma glucose
and cholesterol which were reduced in CHT but not in RHT group (Tab.1).
Both CH and RH groups were glucose intolerant as indicated by a higher area
under glycemic curve (AUC) during the ipGTT (Fig.
10.2c
). Blood glucose levels
peaked at 30 min for all experimental groups but its decay was impaired in CH and
RH mice. TAU supplementation improved glucose tolerance in CHT but not in RHT
group as indicated by the AUC (Fig.
10.2c
). Both groups treated with HFD increased
energy intake and TAU supplementation decreased the caloric intake only in CHT
group (Fig.
10.3
).
10.3.2
Insulin-Signaling Proteins in Hypothalamus
Malnourished mice showed a 38% lower pIRS-1 hypothalamic amount compared to
C mice (
P
< 0.05; Fig.
10.4a
). HFD reduced basal hypothalamic pIRS-1 in CH and
CHT mice compared to C (
P
< 0.05). In RH mice, despite a decrease of 17% in
pIRS-1 protein content in the hypothalamus, no statistical significant difference was
observed when compared to R mice (Fig.
10.4a
). Akt phosphorylation did not differ
in both types of mice groups fed on an HFD compared with their respective controls
(Fig.
10.4b
). However, TAU supplementation increased 35% pAkt hypothalamic
content in CHT mice compared to CH (
P
< 0.05: Fig.
10.4b
).
Search WWH ::

Custom Search