Database Reference
In-Depth Information
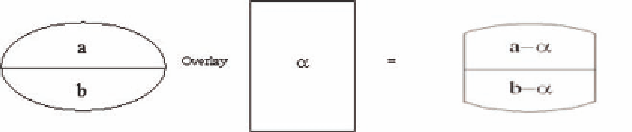
Figure 6. Overlay operator
tial attribute of the spatial members. The spatial
hypercube does not change its structure.As under-
lined in Bimonte, et al. (2007b), it represents an
important limit, as the spatial analysis process is
iterative and flexible, or, in other words, the user
can change and transform spatial data all along the
spatial decisional process. GeWOlap fits buffer,
overlay and dissolve spatial analysis operators to
the multidimensional paradigm. Indeed, GeWOlap
provides three new spatio-multidimensional
operators which dynamically create new spatial
members thanks to spatial analysis operators and
calculate their associated measures using MDX
formula and/or Java user-defined functions. The
“Dissolve” operator merges adjacent spatial
members having an alphanumeric attribute with
the same value. This attribute is chosen by the
user through the Dissolve's wizard. The “Buffer”
operator (Bimonte, et al., 2007b) creates a buffer
region around one spatial member selected by
the user through a mouse click on the interactive
map. The distance of the region buffer is chosen
by the user thanks to the Buffer's wizard. The
GIS overlay operator creates a new layer whose
features are obtained using the intersection op-
erator on two input layers as shown in Figure 6.
GeWOlap adapts this operator to create n new
spatial members (Bimonte, et al., 2007b).
We present here an example of the “Dissolve”
operator as it is representative of this class of opera-
tors.An example is shown in figure 7. Starting from
the query represented in figure 7a, which shows
pollution average values for Ile de France's depart-
ments, the analyst chooses the department type
attribute. Since “Essone” and “Seine-et-Marne”
are adjacent and their type is “Commercial”, then
they are merged into one new region.A new spatial
member (“Essone-Seine-et-Marne”) is created,
and its measure is calculated using a weighted
average on the surface (Figure 7b).
Previous examples show spatio-multidimen-
sional operators applied to geographic dimensions
with numerical measures. Similarly, GeWOlap
supports geographic measures. In this case, pivot
table's cells contain identifiers of geographic ob-
jects and the interactive map shows geographic
measure dynamically chosen by the user. More
details about aggregation and visualization of
geographic measures, and the implementation of
“Permute” operator can be found in Bimonte et
al. (2006) and Bimonte (2007).
In addition to spatio-multidimensional opera-
tors, GeWOlap provides also pure GIS function-
alities: “Zoom in/out”, “Pan”, “Retrieve”, “Map
print”, “Map export”, “Rule tool” and “Control
Layer”. “Pan” allows moving the map using the
mouse, “Map print” permits to print the map and
“Map export” permits to save map in JPG and PDF
formats. “Rule Tool” is a metric tool that calcu-
lates distance between two points selected by the
user. Finally, “Control Layer” provides different
functionalities. It allows customizing the visual
representation of visual variables: colour, size,
etc., backgrounding the spatio-multidimensional
application by adding raster and/or vector layers,
and querying the spatial data warehouse using
Spatial SQL.
In conclusion, GeWOlap is a full-featured
OLAP-GIS integrated solution, which supports
geographic dimension and numerical measures, and
implements drill and cut multidimensional opera-
tors. Moreover, GeWOlap enriches existing SOLAP
Search WWH ::

Custom Search