Information Technology Reference
In-Depth Information
bTb
min
s
2
ζ
s
1
Σ
i
q
i
2
/
λ
i
t
λ
3
λ
2
λ
1
max
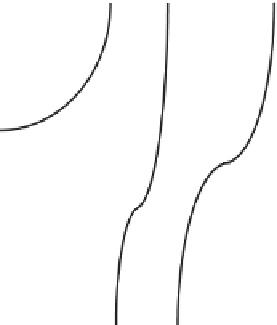
Figure 5.5
Graphical method for the determination of critical point parameters for a three-
dimensional case;
h
(
t
) is given by the nonvertical dashed straight line for two different GTLS
problems (the horizontal line is the DLS); the solid curve is
l
(
t
).
t
min
t
min
B
>
1
B
<
1
A/(B
−
1)
ζ
ζ
−
1/(B
−
1)
1/(1
−
B)
−
A/(1
−
B)
Figure 5.6
Plots of the solution locus parameter as a function of the type of GeTLS problem
for all possible
A
and
B
.
1. The intersection for the maximum holds at
t
=+∞
; it agrees with the
observation that the maximum for the DLS problem is at the TLS hyper-
plane origin.
2. The distance of a saddle to the asymptote at which its locus tends depends
on
b
T
b
.
The positions of the branches of the hyperbolas in the plane
z
i
z
j
(see
Figures 5.7 and 5.8 for the two-dimensional case) depend on the signs of the
corresponding
q
i
and
q
j
[i.e., the signs of the coordinates of the OLS solution
z
(see Theorem 101) because
λ
i
≥
0
∀
λ
i
]. Hence, knowledge of the OLS solution
indicates the quadrant containing the solution locus for every plane
z
i
z
j
.


Search WWH ::

Custom Search