Information Technology Reference
In-Depth Information
g(
γ
)
σ
n
2
σ′
n
2
σ′
n
2
σ
n
2
σ
1
2
σ
1
2
σ
1
2
1
1
+
−
γ
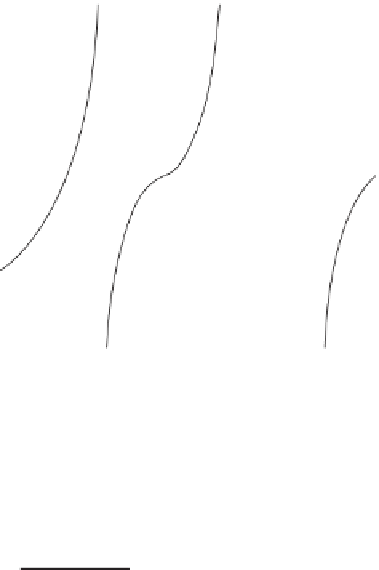
Figure 4.15
Plot of
g
as a function of the
E
TLS
level. (
See insert for color representation of
the figure
.)
and the ratio of the operation counts of the inverse iteration method (see Section
1.13.2) to that of TLS EXIN is given by [98, p. 146 alg. 5.2]
1
6
n
3
K
i
1
2
m
(
3
n
+
1
)
3
4
n
2
7
3
n
k
(
m
,
n
)
=
+
+
+
n
(
n
+
7
)
(4.45)
where
K
i
is the number of inverse iteration steps for given
C
. The two ratios are
plotted in Figures 4.13 and 4.14, respectively. Notice the better behavior of the
method proposed here for large
C
.
4.7 TLS COST LANDSCAPE: GEOMETRIC APPROACH
m
×
n
This discussion is based on [156]. Consider the system
Ax
=
b
,where
A
∈
m
. The TLS cost function (2.122) results in the ratio of positive definite
quadratic forms
Q
N
and
b
∈
(
x
)
and
Q
D
(
x
)
:
T
x
T
A
T
Ax
−
2
b
T
Ax
+
b
T
b
1
+
x
T
x
E
TLS
(
x
)
=
(
Ax
−
b
)
(
Ax
−
b
)
1
+
x
T
x
Q
N
(
x
)
Q
D
(
x
(4.46)
=
=
Form
Q
N
(
x
)
generally contains second-order terms, first-order terms, and a con-
stant term. It is positive definite, as it is the squared modulus of the nonnull
vector
Ax
−
b
. The form
Q
D
(
x
)
contains only the squared modulus of
x
plus 1.
Thus,
Q
D
(
x
)
is greater or equal to 1.


Search WWH ::

Custom Search