Environmental Engineering Reference
In-Depth Information
10.0
250
SO
2
9.0
8.0
200
7.0
6.0
5.0
150
Generation
4.0
100
3.0
NO
x
2.0
50
CO
2
1.0
_
-
6:00 am
6:00 pm
12:00 am
6:00 pm
12:00 pm
Source: CEMS, BENTEK Energy
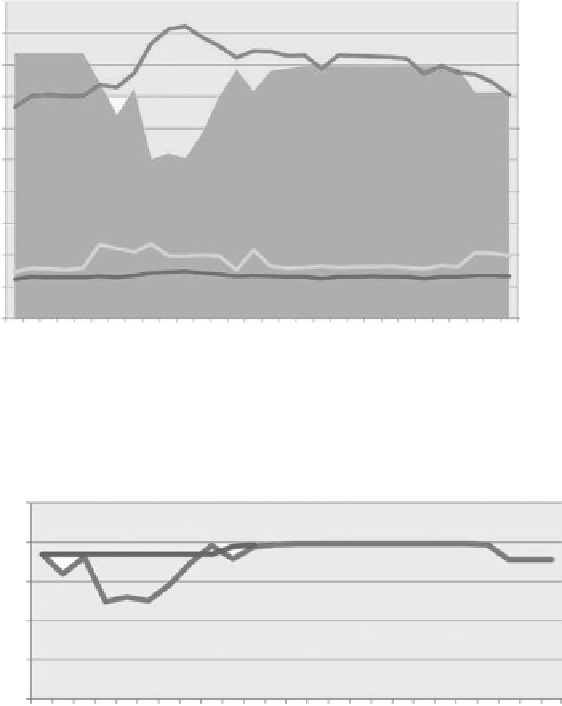
FIGURE 2.24
J.T. Deeley plant generation and emission rates, November 8-9, 2008.
250
200
150
100
11/9 Actual
50
-
FIGURE 2.25
J.T. Deeley plant generation, November 9, 2008.
emitted 8% more SO
2
and 10% more NO
X
while saving 2% of CO
2
emissions.
This case study indicates that, like the PSCO examples, coal plants in Texas
operate at the highest efficiency during steady-state operations at the levels
for which they are designed. Operating these facilities irregularly or at non-
design levels leads to inefficient operation and higher emission levels.
Conclusions Related to ERCOT Operations
The ERCOT system was studied due to the availability of wind data to cor-
relate with coal cycling events and because of the system's larger gas-fired