Environmental Engineering Reference
In-Depth Information
73% over 2007 and increased another 23% in 2009 over 2008. The incremental
growth in 2009 appears to have had a more profound impact on the incidence
of cycling than did the larger growth in 2008. This suggests that the impact
of wind is cumulative: the more wind that comes on the system, without
corresponding additions of other generation forms, the more wind-induced
coal cycling results.
Emission Impacts: J.T. Deeley Plant Case Study
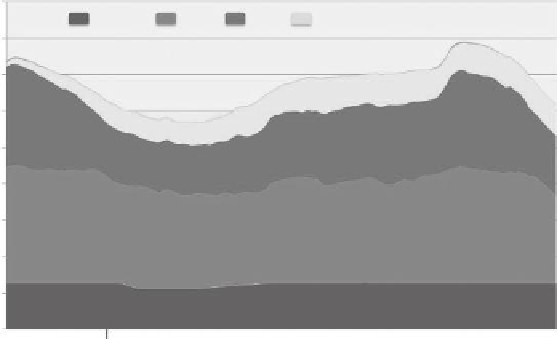
Data for November 8 and 9, 2008, show contrasting generation results.
Figure 2.22 illustrates the generation mix for both days. Little wind gen-
eration was present on the morning of November 8. Wind accounted for
2% of total generation that day. As a result, coal-fired generation produced
power consistently throughout the morning until late evening. About
8:00 p.m. on November 8, wind generation began coming online and grew
until it peaked about 7:00 a.m. on November 9. Wind generation was strong
throughout November 9 and accounted for 12% of total generation. Coal
units were cycled throughout that day to accommodate wind generation.
One coal-fired plant was chosen to illustrate the impact of coal cycling.
The J.T. Deeley plant was one of the plants that accommodated the wind
on November 8-9. Figure 2.23 details hourly generation and emissions.
The graphic shows a sharp drop in generation, beginning about 9:00 p.m.
SO
2
initially followed suit and fell until generation began to rise about 4:00
a.m. on November 9. After that, SO
2
rose with increased generation and
did not flatten out when generation reached its peak around 7:00 a.m. For
9,000
Coal
Gas
Wind
Nuclear
8,000
7,000
6,000
5,000
4,000
3,000
2,000
1,000
-
6:00 pm
12:00 am
6:00 am
12:00 pm
6:00 pm
Nov 8
Nov 9
Sources: CEMS, BENTEK Energy
FIGURE 2.22
ERCOT generation mix on November 8-9, 2008.